
The Fed's Financial Accounts: What's Uncle Sam's Largest Asset
Note: We've updated the quiz based on yesterday's release of Q4 2017 Financial Accounts of the United States (previously referred to as the Flow of Funds Accounts). Hint: The correct answer is the same as it was for the last quiz.
Pop Quiz! Without recourse to your text, your notes or a Google search, what line item is the largest asset in Uncle Sam's financial accounts?
- A) U.S. Official Reserve Assets
- B) Total Mortgages
- C) Taxes Receivable
- D) Student Loans
The correct answer, as of the latest quarterly data, is ... Student Loans.
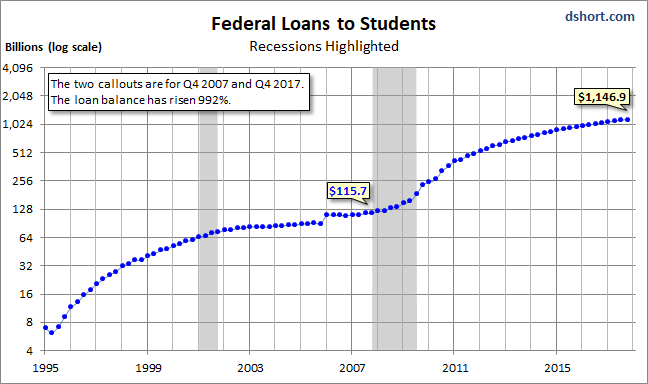
The rapid growth in student debt has been an ongoing topic in the financial press. A stunning chart that continues to haunt us illustrates the rapid growth in federal loans to students since the onset of the great recession. The chart is based on the Federal Reserve's Financial Accounts data (available here) for government's assets and liabilities. We've used a log-scale vertical axis.
(Click on image to enlarge)
For a more dramatic look at the same data, here it is with a standard linear axis.
(Click on image to enlarge)
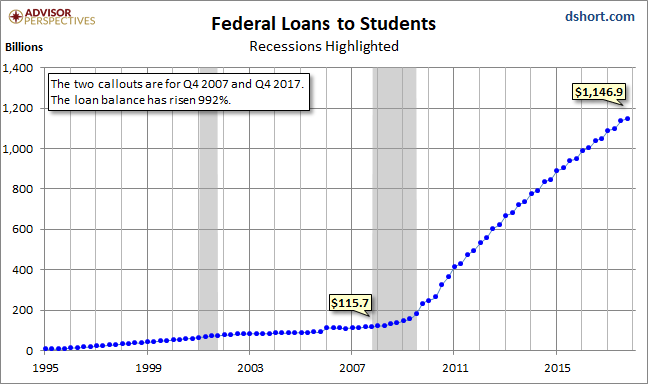
As we point out on the chart, the two callouts are for Q4 2007, the quarter in which the Great Recession began (December 2007), and the most recent quarter on record, Q4 2017. The loan balance has risen an astonishing 992 percent over that time frame, most of which dates from after the recession.
This chart only includes federal loans to students. Private loans increase the debt burden. The Federal Reserve Bank of New York regularly tracks household debt and credit. In their most recent update, they calculate student loan debt to be nearing $1.38 trillion. Incidentally, the number of defaulted student loans hit a new high in 2016, according to a 2016 Time article.
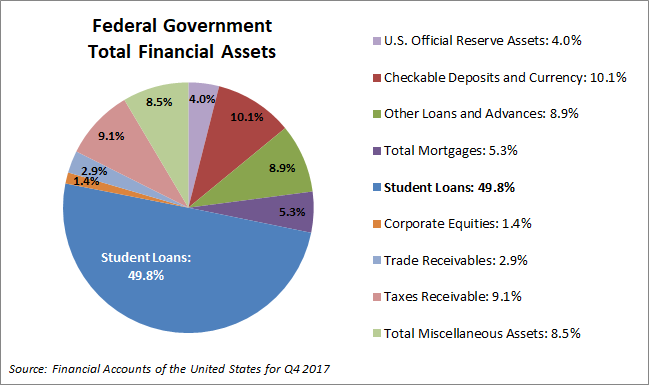
But back to our quiz. Student loans may be a liability on the consumer balance sheet, but they constitute an asset for Uncle Sam. Just how big? It's 49.8 percent of the total Federal assets. This is 9.5 times larger than the 5.3 percent for the Total Mortgages outstanding and 5.5 times the size of Taxes Receivable at 9.1 percent.
(Click on image to enlarge)
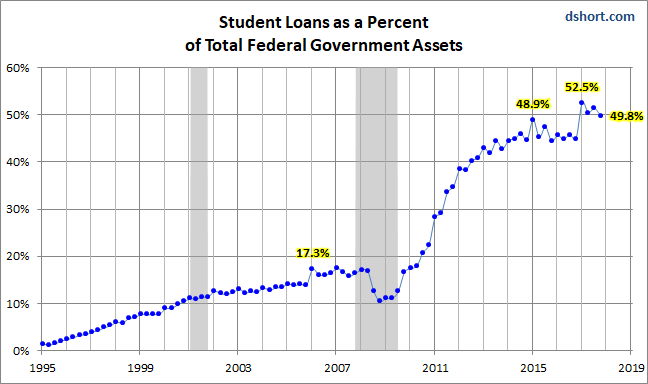
The 49.8 percent referenced is below its peak. Here is a look at how this metric has changed since 1995.
(Click on image to enlarge)
Of course, assets are, sadly, the trivial side of Uncle Sam's Financial Accounts balance sheet — about 2.30 Trillion. The liability side totaled 19.19 Trillion at the end of Q4 2017.
Here is a chart of data from the relevant Consumer Price Index sub-component reaching back to 1978, the earliest year Uncle Sam provides a breakout for College Tuition and Fees. As an interesting sidebar, we've thrown in the increase in the cost of purchasing a new car as well as the more substantial increase for the broader category of medical care, both of which pale in comparison.
(Click on image to enlarge)
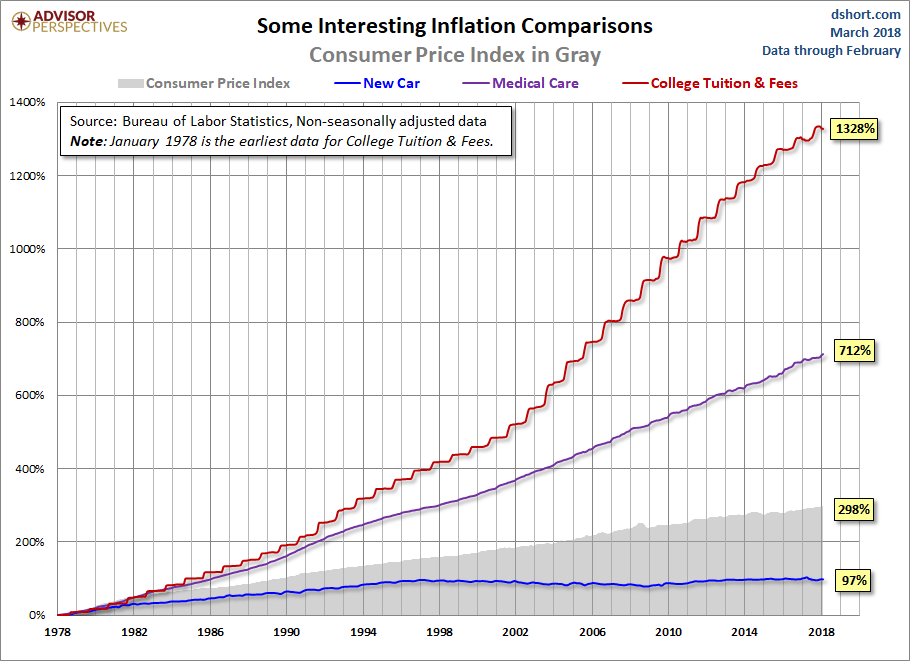
During the decade of the 1990's, when real out-of-pocket funding declined 25%, tuition and fees rose 92%, which sounds substantial ... until you compare it to the 1328% across the complete data series. For early boomers paying for college was sort of like buying a car. But in recent decades, it has become more like buying a house, for which the strategy of a minimum down payment is commonplace for first-time buyers.
The student loan bubble, the biggest slice in Uncle Sam's asset pie, will haunt us for many years to come.
Disclosure: None.


