The Canadian Dollar Had Shed Weight For The Eighth Straight Day
Image Source: Unsplash
- The Canadian dollar slid down another tenth of a percent against the greenback on Friday.
- Despite upbeat labor data from Canada, markets deferred to the US dollar.
- US PPI inflation cooled to flat in September, but core PPI remained an issue.
The Canadian dollar fell against the greenback for the eighth consecutive trading day on Friday, as markets pivoted out of the Loonie in favor of the US dollar. US Producer Price Index (PPI) inflation cooled more than expected in September, but markets noted that core PPI inflation still ticked higher for the annualized period.
Canada’s labor print did little to bolster the Canadian dollar, despite new jobs data nearly doubling forecasts. Canada’s Unemployment Rate also ticked down, flaunting market expectations of another move higher.
With the Bank of Canada (BoC) broadly expected to deliver another 50 bps rate cut at its next policy meeting later in the month, markets have had little reason to bid up the Canadian dollar. The Loonie is now poised for its worst week against the greenback since March of 2023.
Market Movers
- Canada added 46,700 net new jobs in September, nearly double the median market forecast of 27,000, compared to August’s 22,100.
- Canada’s Unemployment Rate also ticked down to 6.5% from 6.6%, reversing the expected uptick to 6.7%.
- Despite upbeat labor figures, the BoC is still expected to cut rates by another 50 bps on Oct. 23.
- US PPI inflation flattened in September, cooling to 0.0% month-over-month compared to the expected 0.1% and August’s 0.2%.
- September’s year-over-year PPI print chilled less than expected, printing at 1.8% versus the expected 1.6%, but it still came in under August’s revised print of 1.9%.
- Core PPI inflation, excluding food and energy prices, actually rose to 2.8% year-over-year in September, over and above the anticipated 2.7%. August’s annualized PPI figure was also revised to 2.6% from the initial print of 2.4%.
Canadian Dollar Price Forecast
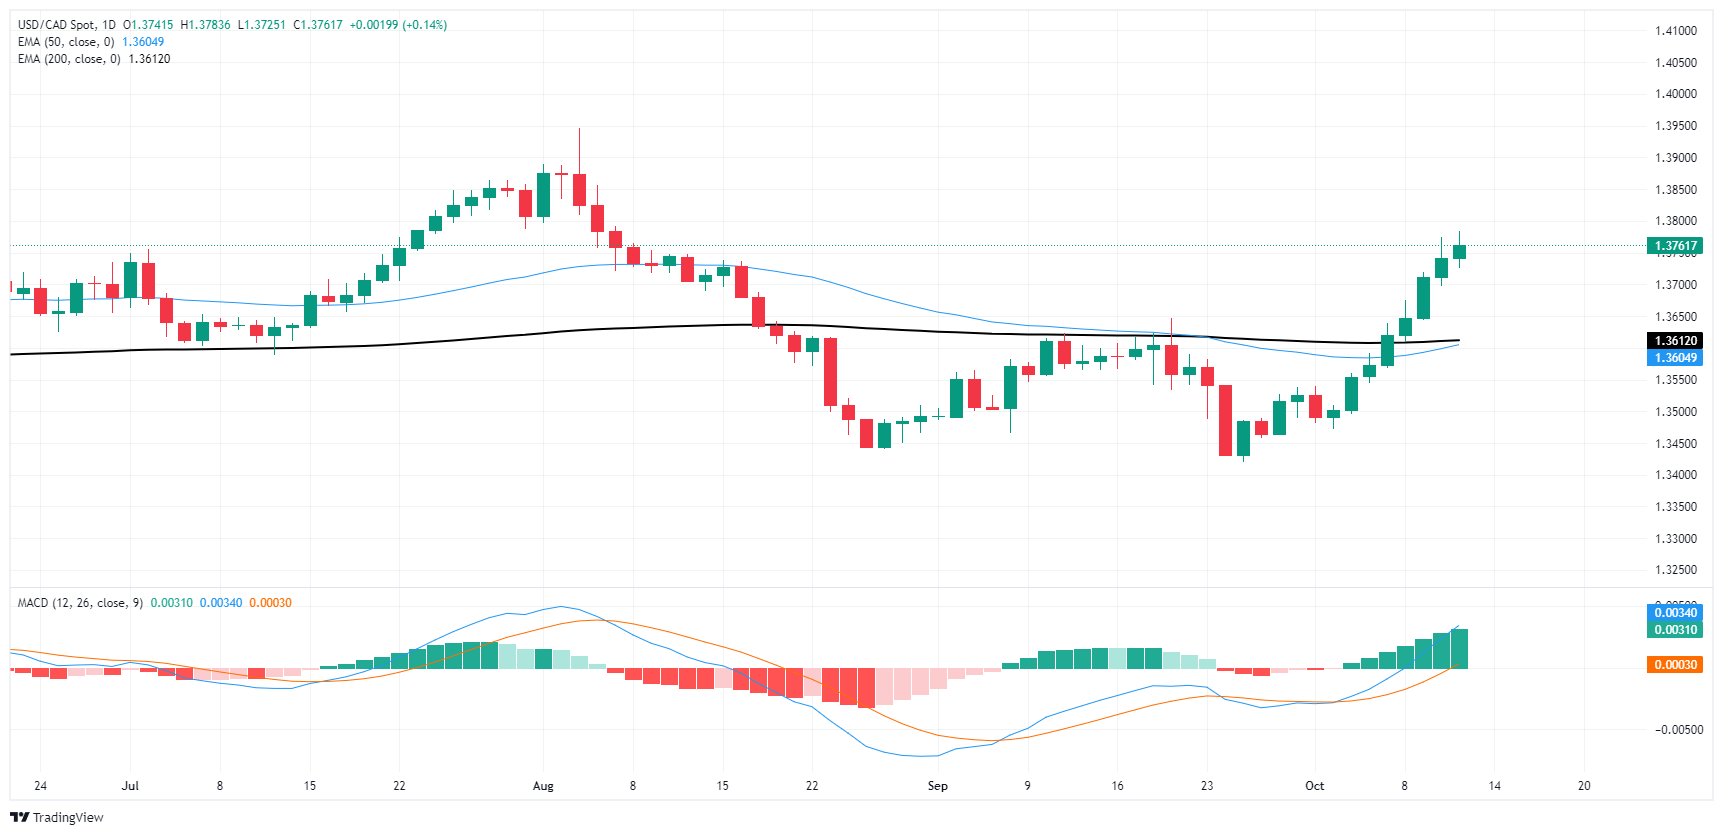
The USD/CAD currency pair continued its recent upward momentum, as it closed the week at 1.3762, up 0.15% for the day on Friday. The pair rallied sharply over the past week, as it recovered from September’s lows near 1.3400.
As seen in the chart, the price action was well above the 50-day exponential moving average (EMA) at 1.3605 and the 200-day EMA at 1.3612, indicating a potential shift toward a more bullish outlook. The pair broke above these key moving averages at the beginning of October, confirming a breakout from the downtrend that had dominated throughout August and September.
Momentum indicators appeared to support the recent bullish reversal. The Moving Average Convergence Divergence (MACD) indicator turned positive, as the MACD line crossed above the signal line. The histogram was steadily increasing, which demonstrated growing bullish momentum.
With MACD readings in positive territory, the outlook seemed to suggest that further gains could be likely in the near-term, with the next key resistance level around 1.3800, which is a psychological and technical barrier that traders should monitor closely.
However, the recent rally left the pair overextended in the short-term, as indicated by the rapid pace of gains over the last few sessions. A pullback to test the 50-day EMA or the 1.3650 level could be possible before the pair next attempts to break higher.
Overall, the trend appears to have shifted in favor of the US dollar, but traders should keep an eye on upcoming economic data and any signs of exhaustion in the bullish momentum to manage potential volatility.
USD/CAD Daily Chart
(Click on image to enlarge)
More By This Author:
Dow Jones Industrial Average Taps Fresh Record After US PPI Inflation Cools In September
Canadian Dollar Tumbles For Sixth Straight Day
Canadian Dollar Falls Further As Canadian Trade Balance Contracts


