
The Bullish Trend Everyone Is Waiting For, But Nobody’s Looking At

Image Source: Pexels
While most analysts and the media are focused on the two primary market-driving economic data points, the labor market and inflation, there’s another data series that will likely determine how the market responds to employment and inflation data in 2026.
Ironically, few investors are talking about it. Some are even denying it’s real, but as you can see in the chart below, it’s taking off and could push stocks much higher for years, just like it did in the late 1990’s.
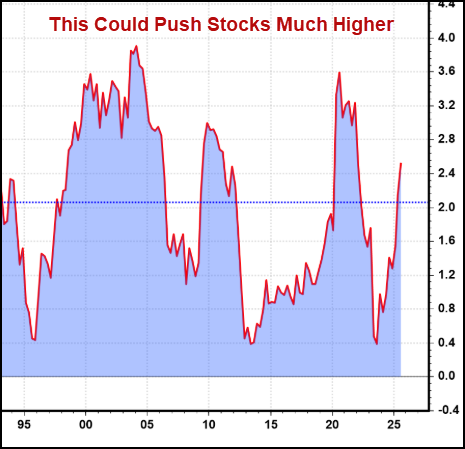
However, one data series (that doesn’t get a lot of attention) isn’t going to fuel a bull market alone. So, before we dive into this obscure economic data, let’s review the economic data that primarily is on investors' minds.
Two weeks ago, in the column titled, "The New Bull Market Formula How to Keep The Bull Market Strong," I outlined a framework for identifying stocks that are most likely to experience a strong bull trend. At the core of that framework is the belief that it takes several different kinds of trends to align to get a big move.
While those same characteristics can be used to anticipate the moves in the equity indexes, there is a similar framework that can be applied to understanding “what kind of economy” we’re experiencing. Different flavors of economic growth will have different outcomes for the stock market.
This is why the market is so focused on the “nuance” of the labor market being described as a “no hire, low fire” weakness versus a labor market where firing and layoffs are the focus. As always, I’ll suggest that this nuance is less important than how the market reacts to the labor data report. So, let’s start there.
Was Friday’s Unemployment Data Bullish?
Last week, the market focused on the employment report. The labor market is the biggest reason the Fed would continue cutting rates. The immediate response to the unemployment rate being slightly better than expected (lower) led many market strategists to conclude that the Fed would not lower rates in January.
In the recent past, such a conclusion would have likely sent stocks and bonds lower. Instead, the market’s initial pre-market reaction was slightly positive.
A slightly higher open in the regular session was followed by a brief selloff, which tested the bulls' resolve and created the Opening Range reversal pattern (which we teach as a “how to buy the dip” strategy), and then rallied confidently into the afternoon.
In the afternoon, the broader indexes, IWM and RSP (S&P 500 equal-weighted), took a breather, while the big-caps continued to climb for the rest of the day.
Friday’s trading pattern is one I wish all our members and readers knew well, as it can offer low-risk entries for day traders, swing traders, and investors. It also may provide insight into the strength of the bigger trends – especially when it is a reaction to an important news event like last Friday.
It’s even more powerful when we’re in a bullish January trend trade condition, which was described as “what to watch out for” in last week’s column titled, “Watch Out For The Market’s 2026 Balancing Act.” The January trend trade has been in full gear after last week, and it will hit an important milestone this coming week.
Last week’s article highlighted Rocket Lab (RKLB) as a stock in a bullish condition, and almost every day last week, it had a version of the pattern discussed. Instead of gapping up and pulling back, it was pushed lower right on the open, but then found support around the OR Low and FTP zones and rallied for the rest of the day.
The consensus of market strategists on Friday was that the Fed will not cut in January. With that narrative in the market, stocks rallied in a very bullish way.
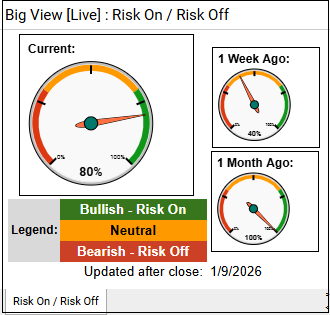
Now, I'll hand things over to Keith. Every week, we review the big picture of the market's technical condition as seen through the lens of our data charts. The bullets below provide a quick summary organized by conditions we see as being risk-on, risk-off, or neutral.
Summary
Overall, risk-on conditions strengthened as major indexes pushed to new highs led by small-caps. Market internals and new-high/new-low readings confirmed broad participation, volatility stayed near lows, and leadership expanded into metals, value, foreign equities, and multiple sectors.
Offsetting this optimism were still-mixed volume patterns, lagging growth versus value, elevated leadership in defensive metals and gold, alongside rising oil, and a few cross-asset signals (SPY/GLD, rates, crypto) that warrant monitoring for early warning signs of growth weakening.
Risk-On
- Indexes were up strong this week, led by small-caps, up over 4.5%. 3 of the 4 have closed on all-time highs in bull phases and aren’t overbought on real motion. We'll likely see some healthy rotation out of the concentrated themes from last year.
- Sectors were up nearly universally (XLU was only sector down).
- The biggest leaders in the market this week were metals, with palladium, silver, and gold miners up significantly. Some of this increase stemmed from geopolitical stress, but also infrastructure and technology demand.
- The cumulative advance decline line and market internals turned positive.
- The new-high/new-low ratio is stacked and sloped positive.
- The moving average of stocks above key moving averages is bullish for both the SPY and IWM, and it appears more mixed for the QQQ.
- Risk gauges flipped back into positive territory, with the SPY/GLD ratio the only one showing risk-off readings.
- Volatility remains low, with cash volatility near its all-time lows.
- New highs were seen in value stocks, while growth stocks are still lagging, though both categories are in bullish phases. Value stocks have been running a little rich in-terms of price momentum. If growth stocks start to drop below the lows of last week, that could be a concerning or early warning sign.
- Foreign equities look to be in a strong uptrend without getting overbought and outperforming the U.S.
- Soft commodities aren’t showing much inflationary pressure.
- January seasonals tend to be very strong, typically led by Nasdaq and with good participation seen in the S&P and IWM.
Neutral
- Volume patterns remain mixed, with strength seen in the DIA and IWM, while readings were much weaker in the SPY and QQQ.
- Gold remains strong, and oil started to move this week. Demand for energy is there, along with persistent geopolitical stress.
- Bitcoin did get a little pop this week, and it looks better on a weekly timeframe.
- Rates had a muted response to the employment numbers, and they remain in a channel.
For actionable trading ideas, please refer to the strategies discussed below.
Stay risk-on, but not maxed out. Breadth, new highs, and global strength support staying invested, while mixed volume and metals leadership argue for discipline.
What to own now:
- Keep core exposure in broad equity and small-cap baskets to capture expanding participation.
- Overweight value/cyclical groups and foreign equities while they continue to lead.
- Hold a tactical sleeve in metals/miners, but manage them actively.
What to be careful with:
- Growth/tech positions should stay on a tighter leash until leadership improves.
- Avoid concentrating in last year’s crowded winners.
What to do this week:
- Add on market digestion days, not strength.
- Rotate, don’t chase — shift capital toward areas showing improving participation and away from fading themes.
- Rebalance exposure weekly based on breadth, leadership, and risk-gauge alignment.
Risk controls:
- Keep overall exposure slightly below full risk-on.
- Begin trimming if growth weakens further, metals continue to dominate leadership, or breadth/new-highs lose confirmation.
More By This Author:
Tariffs Aren’t The Market’s Biggest Problem, Kryptonite (aka Dysprosium & Samarium) IsStocks Don't Mind Gridlock Or Shutdowns
What You’re Not Hearing About September’s Bad Reputation
Disclaimer: The information provided by us is for educational and informational purposes. This information is based on our trading experience and beliefs. The information on this website is not ...
more

