
The Best Small-Cap ETFs: IWM Vs. IJR
iShares Russell 2000 ETF (NYSEARCA:IWM) and iShares Core S&P Small-Cap ETF (NYSEARCA:IJR) are the two biggest U.S. small-capitalization ETFs in the market, with assets under management of $32.32 billion for IWM and $32.8 billion for IJR. These two ETFs obviously move in a very similar way, but there are some important differences that can have big implications for investors.
A Tale Of Two Small-Cap Indexes
To begin with, these two ETFs follow different small-cap indexes: IWM tracks the Russell 2000, while IJR tracks the S&P SmallCap 600. These two indexes are quite different in their construction and methodology, and this has a considerable impact on returns over the years.
The Russell 2000 index followed by IWM is arguably the most widely known small-cap index, and it is the default benchmark for many small-cap active investment funds and asset managers. This index is quite broad and popular, but it is not particularly efficient in its construction.
The Russell 2000 is purely rules-based, and it includes 2000 stocks from the Russell 3000 after eliminating the largest 1000 names among the 3000. Since the Russell 2000 is so widely followed, the prices of stocks that are being included in the index tend to rise in anticipation of inclusion, which ultimately has a negative impact on the performance of the index over the long term.
On the other hand, the S&P SmallCap 600 index followed by IJR is managed by a committee. There are some rules that need to be followed, but the committee ultimately decides which stocks should be included in the index and when those changes should be made.
The S&P SmallCap 600 index also has a higher minimum float requirement, which reduces the cost impact of transactions on prices when including or excluding companies from the index. This approach is not as transparent as in the case of the Russell 2000, but it is more flexible and efficient in terms of rebalancing and reducing the negative impact on prices when including or excluding new companies.
The S&P SmallCap 600 index only considers adding companies that have been profitable in the past quarter and in the past year, which improves the quality of the portfolio. The biggest losers among small caps generally come from companies that never manage to generate enough profitability, so avoiding these chronically unprofitable businesses comes a long way in terms of reducing the risks and even increasing performance for IJR in comparison to IWM.
In simple terms, IWM has a larger index and offers more transparency because it is completely rules-based. However, IJR is more efficient in terms of rebalancing and reducing the negative impact of the buy and sell orders on portfolio returns. IJR also has a quality tilt because it only considers for inclusion companies that have been profitable in the past quarter and in the past year.
Risk, Reward, And Expenses
The two ETFs offer wide diversification. The top 10 positions account for only 4% of the portfolio in the case of IWM and 6.4% of the portfolio in the case of IJR. This means that both IWM and IJR offer more than enough diversification for investors in the small-cap universe.
The two ETFs have relatively low expenses in comparison to other ETFs in the market, but IJR excels with a razor-thin annual expense ratio of 0.07% versus 0.19% for IWM. Both are quite solid in this area, but IJR comes ahead of IWM with its spectacularly low costs.
The chart below shows the historical evolution of the two ETFs since May of 2000, which is as long as we can go because that is the first date in which both IWM and IJR have been available for trading. Data in the charts include not only returns but also volatility and drawdowns as risk metrics.
IJR has gained 400.6% over this period, which means a compounded annual growth rate of 8.5% per year. IWM, on the other hand, produced a smaller total return of 251.4% in the period, an annual rate of 6.5% per year.
The power of compounding can be spectacular in the long term, and what looks like a small difference of 2% in annual returns can make a huge impact on your capital over the long term.
Volatility levels are also slightly lower for IJR, with a standard deviation of 23% versus 24% for IWM. The maximum drawdown, meaning maximum capital loss from the peak, is 58.1% for IJR and 58.6% for IWM. These maximum drawdowns were produced during the Great Financial Crisis in 2008-2009 for both instruments.
However, it is important to note that both ETFs declined by more than 40% from their highs in March of 2020 due to the COVID-19 market crash. Even after making a sharp recovery in the past several weeks, both IJR and IWM remain 29% and 27% below their highs of the year, respectively.
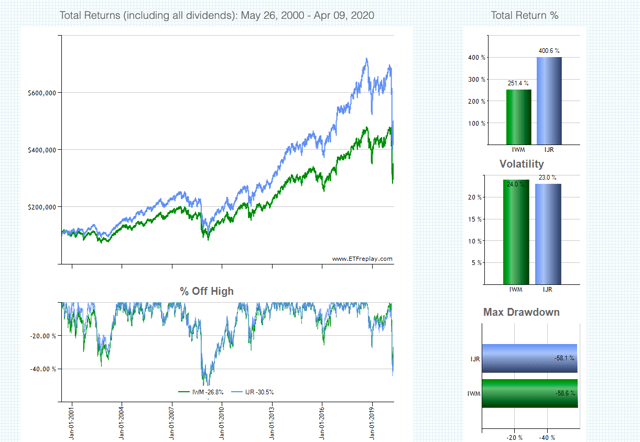
Source: ETF Replay
In case you are thinking that it is already too late to bet on a small-cap recovery in the midst of the coronavirus pandemic, it is important to keep in mind that prices can be volatile in the short term, which generally produces opportunities for investors. In any case, small-cap stocks remain well below their highs, and they could still offer substantial room for recovery if the economy evolves the better in the months and years ahead.
The Bottom Line
IJR has outperformed IWM by a considerable margin over the years, and it has done so with similar or even slightly lower risk levels as measured by volatility and maximum drawdown.
One of the most important factors to consider for index-tracking ETFs is expenses. We never know for sure how return and risk will turn out for the underlying stocks in the portfolio, but keeping expenses as low as possible is clearly a major positive in terms of long-term performance. While both IJR and IWM have very reasonable expenses, IJR still charges less than half of what IWM charges on an annual basis, so IJR wins in this area, too.
IWM replicates the most widely followed small-cap index, and it has some advantages in terms of broadness and transparency. However, IJR is more efficient, it has a portfolio with superior quality, and it has lower expenses. Besides, history shows that IJR has outperformed IWM in terms of return and risk over long periods of time.
In a nutshell, IWM is not a bad ETF to invest in small capitalization U.S. stocks, but IJR is a better vehicle to do so.
Disclosure: I/we have no positions in any stocks mentioned, but may initiate a long position in IJR over the next 72 hours.
Disclaimer: I wrote this article myself, and it expresses my ...
more

