The Best Offense Is Defense – Why VEQTOR Outperformed Last Week
Six minutes after trading began on the New York Stock Exchange on March 9, 2020, the S&P 500® plummeted 7% and market-wide circuit breakers kicked in for the first time since the stock market crash of Oct. 27, 1997. However, the indices fell again later in the week and triggered another circuit breaker on Thursday, March 12. As I was writing this blog, on Monday, March 16, the third circuit breaker rocked the market soon after the open.
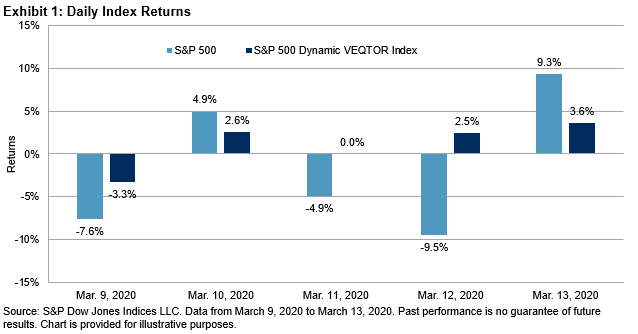
In such a tumultuous market, the best way to win is to not lose. The S&P 500 Dynamic VEQTOR Index was among the few strategies that posted positive returns in the week of March 9, 2020; it gained 5.3% in one of the worst weeks in S&P 500 history (-8.7%).

Although the VEQTOR index lagged the broad market most of the time in 2020 before last week, it finally pulled ahead with its recent success. Exhibit 2 shows how dramatic the reversal of fortune has been. As of March 13, 2020, the S&P 500 lost 15.7% YTD with a volatility of 45.5%, while the S&P 500 Dynamic VEQTOR Index gained 4.2% YTD with a volatility of 16.2%.

The outperformance of the VEQTOR strategy mainly comes from its dynamic allocation to the S&P 500 VIX® Short Term Futures Index, a liquid, tradable proxy of VIX spot. This defensive strategy index monitors the implied and realized volatility in the market and allocates to equity and VIX futures accordingly. Its allocation to VIX futures usually increases in a volatile market and decreases otherwise. In the calm market of January 2020 when VIX was below 15 on most days, VEQTOR maintained a low allocation of 2.5% to VIX futures. However, as VIX shot up more than 300% in March 2020, VEQTOR quickly increased its allocation to VIX futures to 40%. We also observed that VEQTOR took precaution and went to all cash briefly when the index dropped more than 2% in the course of one week (see Exhibit 3).

Historical data shows that both VIX spot and VIX futures tend to have a negative correlation with the equity market, and this correlation is generally strengthened during market crisis, when traditional geographical hedging and cross-asset-class hedging breaks down. Furthermore, the negative correlation between VIX spot and futures and the equity market is convex. This means that when the S&P 500 drops, VIX spot and futures tend to rise even higher. The combination of negative correlation to the equity market and convexity of VIX futures contribute to the recent success of the VEQTOR strategy with an allocation to VIX of less than 50%.
That said, investors must keep in mind that the VEQTOR strategy is designed to hedge tail risk in the broad equities market. Similar to holding a continuously rolling put option, hedging costs over time tend to create a significant performance drag in the long term. As shown in Exhibit 4, the S&P 500 Dynamic VEQTOR Index lagged the S&P 500 in the past decade’s bull market. In general, the index tends to outperform when VIX rises and stays high for a prolonged period.

The famous football saying, “the best offense is a good defense” is true because a good defense means that you are always in the game. The S&P 500 Dynamic VEQTOR Index has lagged the broad equity market in the long stretch of the 10-year bull market. In the recent market shakeup, however, investors who opted for its defensive feature are getting what they paid for.
If you are interested in the S&P 500 Dynamic VEQTOR Index allocation process, please refer to its methodology and our Research paper: Dynamically Hedging Equity Market Tail Risk Using VEQTOR.
The information provided is for informational purposes only and investors should determine for themselves whether a particular service or product is suitable for their investment needs. Graphs and ...
more


