
The 5 Most Oversold Nasdaq 100 Stocks For November 2019
Each month, I scan for stocks in the major averages that have positive or negative momentum, as well as for those that are quite overbought or oversold. This is accomplished by looking at where stocks closed the month in relation to their starc bands. This analysis, like my regular weekly scan of stocks, provides a list of stocks for further analysis and possible recommendation.
The closeness to the starc bands is also a measure of the risk. When a stock or ETF closes near its upper starc band (starc+), it is considered to be a higher-risk buy and is in overbought territory. Conversely, a close near the lower starc band (starc-) indicates that a stock is in a high-risk sell area (also a low-risk buy area), and is in oversold territory.
To be clear, if a stock turns up on my most overbought list, that does not mean it can’t go even higher. The same goes for my most oversold list: those stocks that have declined closest to their starc- bands can still go even lower. But an oversold stock with positive technical indicators is unlikely to decline significantly further, and a technical approach should allow you to both set appropriate stops and predict upside price targets.
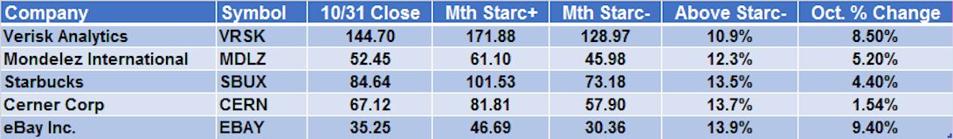
Table - TOM ASPRAY - VIPERREPORT.COM
The most oversold Nasdaq 100 stock after the October close was Verisk Analytics (VRSK). VRSK is a data analytics and risk assessment company that was down 8.5% in October. It closed just 10.9% above its monthly starc- band.
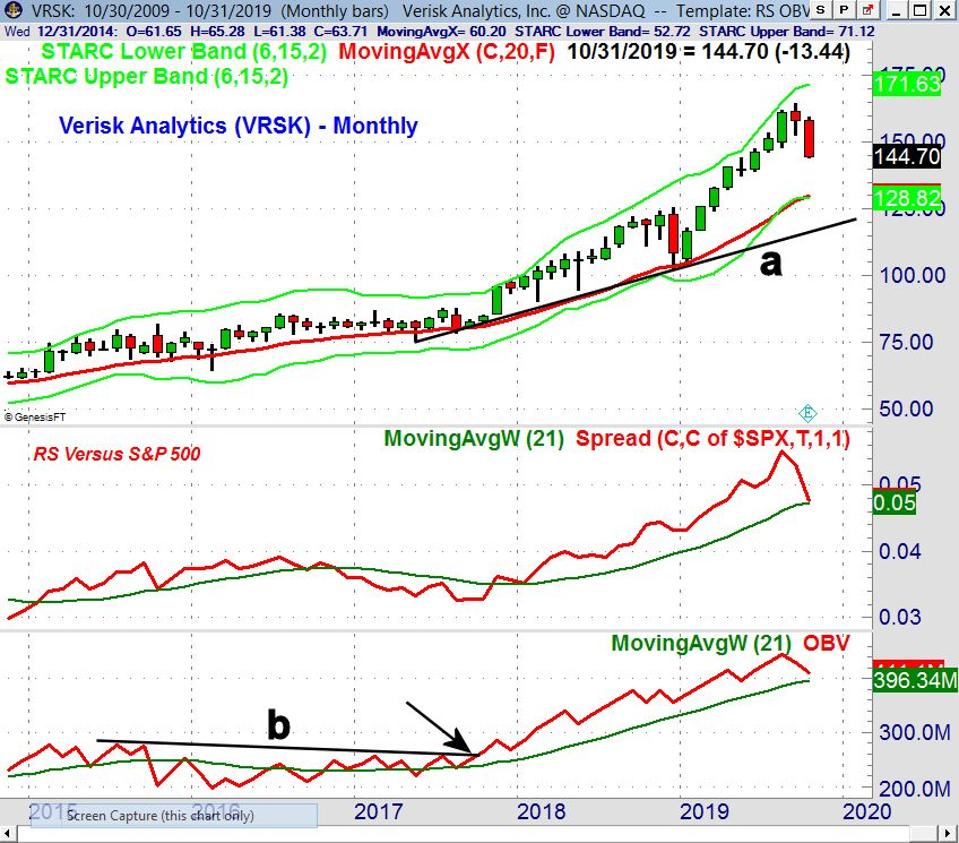
VRSK - TOM ASPRAY - VIPERREPORT.COM
VRSK closed in October below the three-month low of $146.30, which means that anyone who bought the stock since July is holding a loser. The rising 20-month Exponential Moving Average (EMA) is at $129.61, which is just above the starc- band. The monthly relative performance (RS) has turned sharply lower but is still above its Weighted Moving Average (WMA). The On Balance Volume (OBV) completed its bottom in September 2017, when it moved above its resistance (line b). It is declining but still positive.
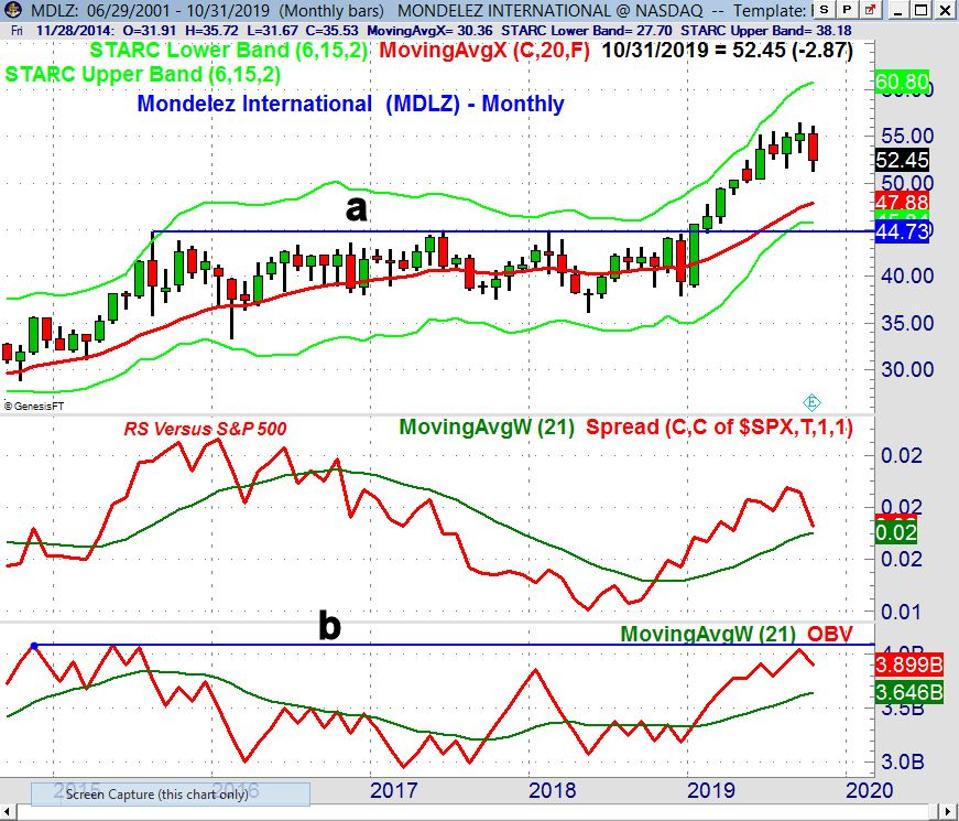
MDLZ - TOM ASPRAY - VIPERREPORT.COM
Mondelez International (MDLZ) was down 5.2% in October but is holding above the support in the $50-area. The still-rising 20-month EMA is at $47.88, and there is major price support at $44.73. Mondelez is still 12.3% above its monthly starc- band.
The monthly indicators are positive on Mondelez. The relative performance is above its WMA, and the On Balance Volume is also above its WMA. The OBV is performing stronger than prices, as it has stayed very close to its recent major high (line b). The weekly indicators (not shown) are negative and declining, with both the weekly RS and OBV having dropped well below their WMA's.
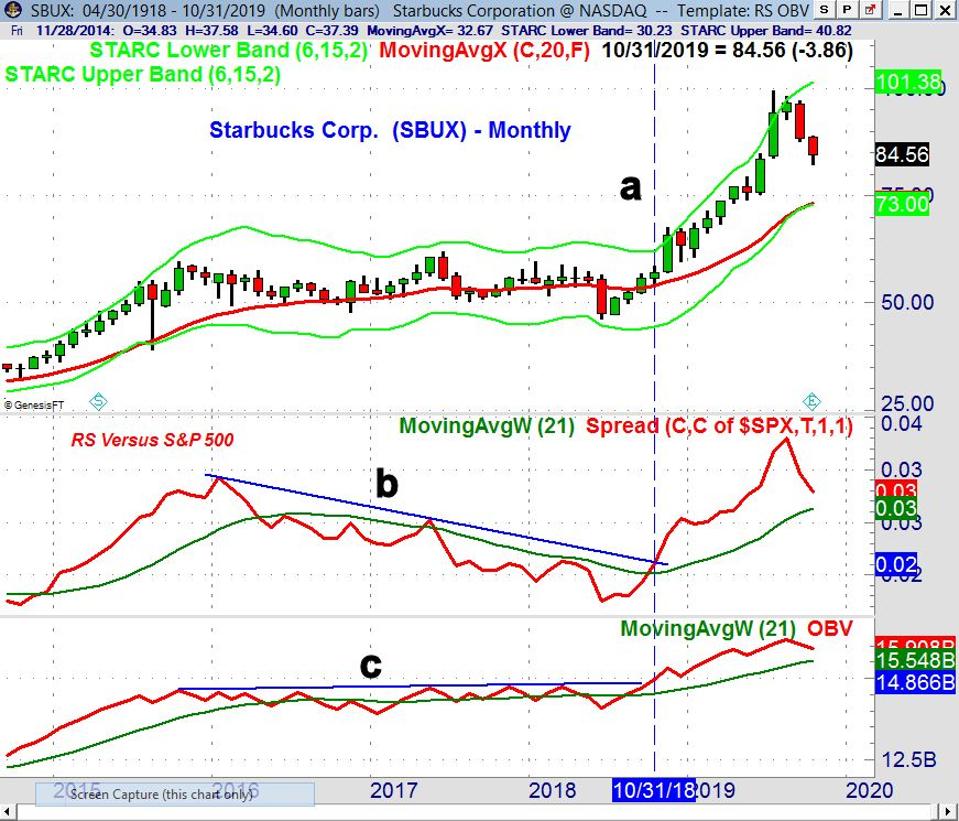
SBUX - TOM ASPRAY - VIPERREPORT.COM
Starbucks Corp. (SBUX) peaked in July at $99.34 and was down 4.4% in October. The next good support is in the $75 area, with the monthly starc- band at $73.18. There is initial resistance at $88.89, which was the October high.
The monthly RS signaled that the SBUX was a market leader in October 2018 as it broke through the downtrend (line b). It was higher in Quarter 4 as the overall stock market was plunging. The OBV also bottomed at the same time (when SBUX closed at $57.17), as it moved strongly above its resistance (line c).
Both the RS and OBV are currently above their WMA's, but declining. There they are currently positive but of course, could turn negative on a further decline in SBUX.
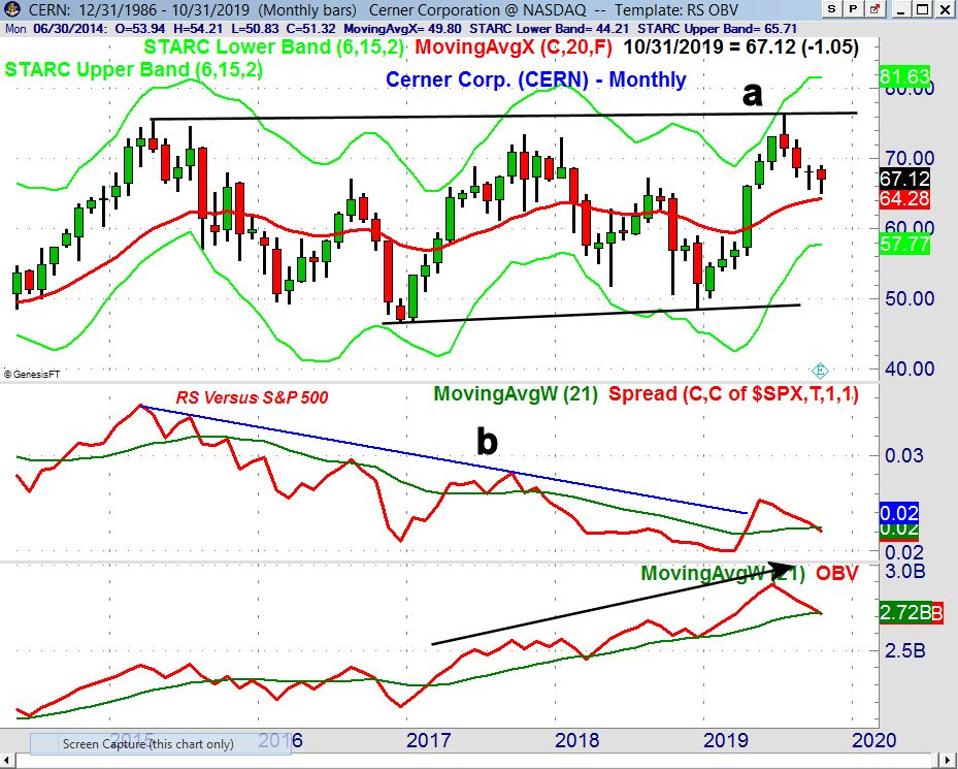
Cern - TOM ASPRAY - VIPERREPORT.COM
Cerner Corp (CERN) peaked at $76.27 In July and had a low this month of $65.02, which was close to the 20-month EMA. This was a 14.7% decline from high to low. CERN also formed a doji in September, which if confirmed by a monthly close above the September high, could be a buy signal. The resistance from the last two monthly highs is at $69.03 and $69.04, which is not too far above the October close of $67.12, 13.7% below the monthly starc+ band.
The monthly RS broke its downtrend (line b) in May, which was a positive sign. Cerner's RS has just closed barely below its WMA in October, so the November close, when compared to the S&P 500, will be important. The monthly OBV has been much stronger than prices since early 2017 when it moved above its WMA. The OBV made a convincing new high in July and has also just dropped barely below its WMA.
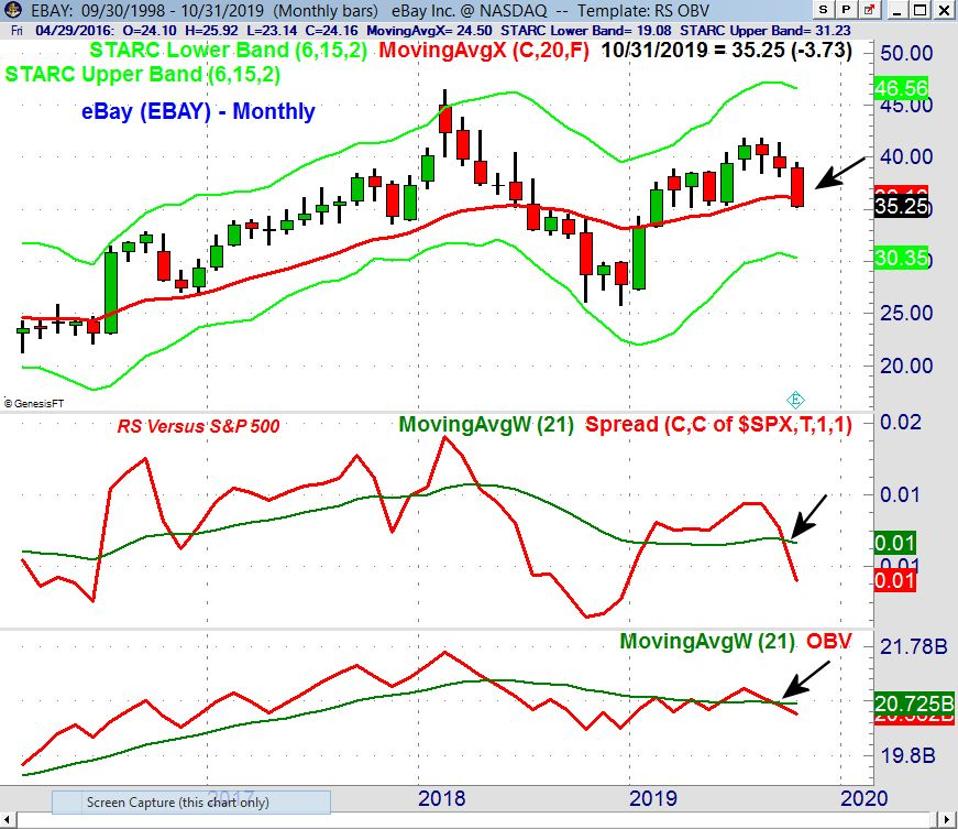
eBay - TOM ASPRAY - VIPERREPORT.COM
eBay Inc. (EBAY) declined the most in October, down 9.4%, closing below the flat 20-month EMA at $36.16. It has declined the furthest since the spring, as it closed October right on the March lows at $35.25. The next support, from February, is at $33.26.
eBay's monthly RS dropped below its WMA in September after forming lower highs. The OBV also crossed below its WMA at the end of September, warning of the decline in October. The weekly technical studies (not shown) show no signs yet of bottoming.
What does it all mean? The monthly analysis of these five oversold stocks suggests they should all be on your radar. Once they bottom out, they should have excellent rally potential. After compiling a list of the most oversold stocks, I then review the weekly technical studies for each of the stocks to see if there are any signs that they are nearing a bottom.
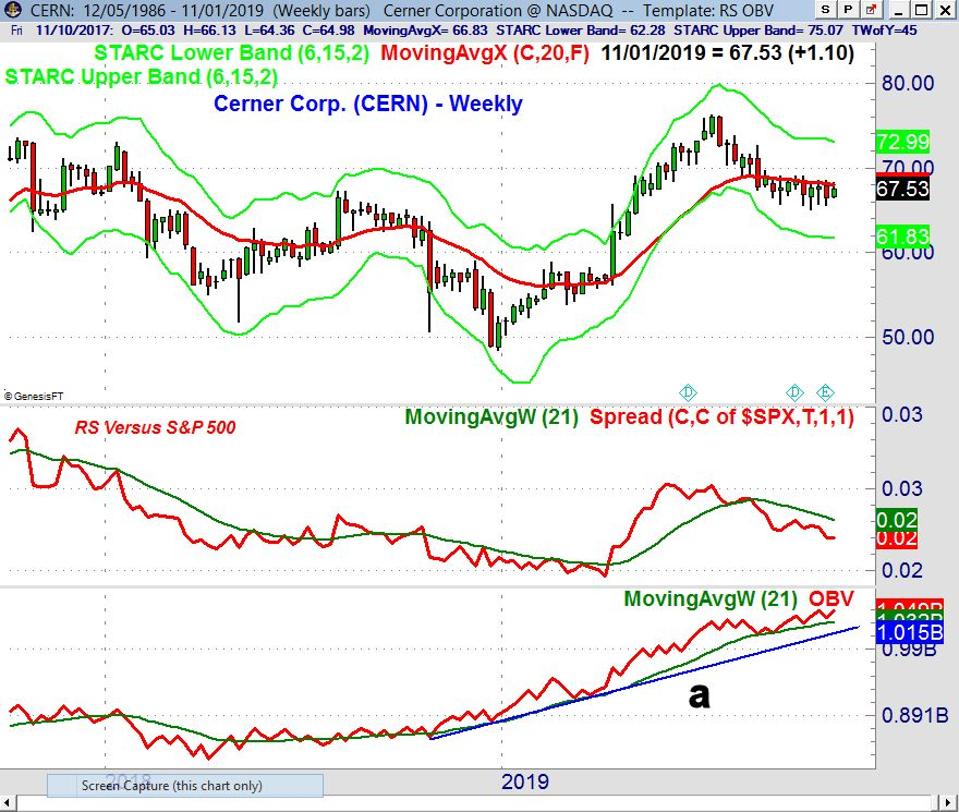
CernWK - TOM ASPRAY - VIPERREPORT.COM
Based on the monthly and weekly analysis, Cerner Corp (CERN) looks the most interesting. CERN has been holding above its 20-month EMA at $64.28. It has stayed just below the slightly-declining 20-week EMA for the past ten weeks. A strong weekly close above the two-month high at $69.04 would be a good sign.
CERN's weekly RS is still well below its declining WMA, which indicates that CERN is performing weaker than the S&P 500. Its weekly OBV, on the other hand, bottomed in late 2018 and has been in a strong uptrend (line a) all year. Monitoring of the daily technical studies and the chart should identify when the worst of the selling in CERN is over. For my current market analysis on Forbes.com see Sunday’s post.


