
The good news is:
- Seasonally, this negative period ends in a few weeks.
The Negatives
New lows increased to extreme crashworthy numbers last week.
The first chart covers the last 6 months showing the Nasdaq composite (OTC) in blue and a 10% trend (19 day EMA) of Nasdaq new highs (OTC NH) in green. Dashed vertical lines have been drawn on the 1st trading day of each month.
OTC NH continued declining as prices fell last week.

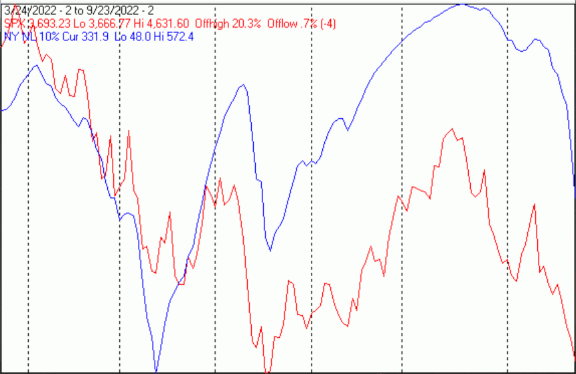
The next chart is similar to the one above except it shows the S&P 500 (SPX) in red and NY NH has been calculated with NYSE data.
NY NH continued declining from a very low level.

The next chart covers the past 6 months showing the OTC in blue and a 40% trend (4 day EMA) of Nasdaq new highs divided by new highs + new lows (OTC HL Ratio), in red. Dashed horizontal lines have been drawn at 10% levels for the indicator; the line is solid at the 50%, neutral level (equal numbers of new highs and new lows).
OTC HL Ratio continued its fall into extremely negative territory.

The next chart is similar to the previous one except it shows the SPX in red and NY HL ratio, in blue, has been calculated with NYSE data.
NY HL ratio, ditto,

The next chart covers the past 6 months showing the SPX in red and a 10% trend (19 day EMA) of NYSE new lows (NY NL), in blue. NY NL has been plotted on an inverted Y axis so decreasing numbers of new lows move the indicator upward (up is good).
NY NL The new low numbers were gigantic. On Friday there were over 1,000 new lows on both the NYSE and Nasdaq.
The next chart is similar to the previous one except it shows the OTC in blue and OTC NL, in brown, has been calculated with Nasdaq data.
OTC NL ditto.

The Positives
Positives are pretty hard to find. Investors are beginning to realize the FOMC is serious about raising rates and draining liquidity.
Seasonality
Next week includes the last 5 trading days of September during the 2nd year of the Presidential Cycle. The tables below show the daily change, on a percentage basis for that period.
OTC data covers the period from 1963 to 2021 while SPX data runs from 1928 to 2021. There are summaries for both the 2nd year of the Presidential Cycle and all years combined.
Average returns for the coming week have been negative by all measures.
Report for the last 5 days of September.

The number following the year represents its position in the Presidential Cycle.

The number following the daily return represents the day of the week;

1 = Monday, 2 = Tuesday etc.


OTC Presidential Year 2 (PY2)

               Day5      Day4      Day3      Day2      Day1      Totals

 1966-2       0.11% 1   0.34% 2   0.27% 3  -1.06% 4  -0.96% 5    -1.29%

 1970-2       1.10% 4   2.26% 5   0.55% 1   0.49% 2   0.57% 3     4.97%

 1974-2      -1.36% 2  -0.15% 3  -1.51% 4  -1.30% 5  -2.54% 1    -6.86%

 1978-2      -0.14% 1   0.61% 2  -0.68% 3  -0.01% 4   0.67% 5     0.45%


 1982-2       0.24% 5   0.02% 1   0.21% 2  -0.41% 3  -0.32% 4    -0.26%

 1986-2       0.33% 3  -0.85% 4   0.03% 5  -1.08% 1   0.90% 2    -0.67%

 1990-2      -2.79% 1   0.74% 2  -1.34% 3  -2.53% 4   0.97% 5    -4.93%

 1994-2      -0.24% 1  -0.03% 2   0.61% 3  -0.09% 4   0.65% 5     0.90%

 1998-2      -2.27% 4   1.35% 5  -0.25% 1  -0.29% 2  -2.32% 3    -3.79%


 Avg         -0.95%     0.25%    -0.15%    -0.88%    -0.02%      -1.75%


 2002-2      -0.23% 2   3.39% 3  -0.06% 4  -1.84% 5  -2.26% 1    -0.99%

 2006-2       1.36% 1   0.55% 2   0.09% 3   0.29% 4  -0.51% 5     1.78%

 2010-2       2.33% 5  -0.48% 1   0.41% 2  -0.13% 3  -0.33% 4     1.80%

 2014-2       1.03% 3  -1.94% 4   1.02% 5  -0.14% 1  -0.28% 2    -0.31%

 2018-2       0.08% 1   0.18% 2  -0.21% 3   0.65% 4   0.05% 5     0.74%


 Avg          0.91%     0.34%     0.25%    -0.23%    -0.67%       0.60%


OTC summary for PY2 1966 - 2018

Averages     -0.03%     0.43%    -0.06%    -0.53%    -0.41%      -0.61%

% Winners       57%       64%       57%       21%       43%         43%

MDD  9/30/1974  6.69% --  9/27/1990  5.81% --  9/30/2002  4.11%


OTC summary for all years 1963 - 2021

Averages     -0.06%    -0.01%    -0.18%    -0.17%     0.00%      -0.42%

% Winners       54%       52%       47%       43%       49%         47%

MDD 9/29/2008  9.28% --  9/30/1974  6.69% --  9/30/2003  6.04%


SPX PY2

               Day5      Day4      Day3      Day2      Day1      Totals

 1930-2      -1.89% 4  -1.52% 5  -0.72% 6  -2.23% 1  -1.43% 2    -7.79%

 1934-2       2.81% 2  -0.66% 3   0.99% 4  -1.09% 5   0.22% 6     2.27%

 1938-2      -2.99% 1  -0.27% 2   4.46% 3   3.66% 4   2.86% 5     7.71%


 1942-2       0.45% 5  -0.22% 6   0.11% 1  -0.45% 2   0.00% 3    -0.11%

 1946-2       2.15% 2   2.58% 3   1.13% 4  -1.05% 5  -0.99% 1     3.82%

 1950-2      -0.10% 1  -1.44% 2   1.41% 3   0.05% 4   0.15% 5     0.07%

 1954-2       0.68% 5   0.40% 1   0.49% 2  -0.58% 3  -0.58% 4     0.41%

 1958-2       0.44% 3  -0.42% 4   0.18% 5   0.42% 1   0.38% 2     1.01%


 Avg          0.73%     0.18%     0.66%    -0.32%    -0.21%       1.04%


 1962-2      -1.84% 1   0.58% 2  -1.42% 3  -0.68% 4   0.90% 5    -2.46%

 1966-2       0.24% 1   0.31% 2  -1.27% 3  -1.04% 4   0.33% 5    -1.42%

 1970-2       1.30% 4   0.07% 5  -0.13% 1   0.52% 2  -0.11% 3     1.66%

 1974-2      -2.02% 2  -0.66% 3  -1.64% 4  -2.29% 5  -2.16% 1    -8.76%

 1978-2       0.02% 1   0.75% 2  -0.94% 3   0.30% 4   0.57% 5     0.69%


 Avg         -0.46%     0.21%    -1.08%    -0.64%    -0.09%      -2.06%


 1982-2      -0.40% 5   0.24% 1  -0.31% 2  -1.31% 3  -0.97% 4    -2.74%

 1986-2       0.26% 3  -1.88% 4   0.17% 5  -1.00% 1   0.61% 2    -1.84%

 1990-2      -2.16% 1   1.20% 2  -1.04% 3  -1.34% 4   1.69% 5    -1.65%

 1994-2       0.25% 1   0.27% 2   0.60% 3  -0.56% 4   0.10% 5     0.66%

 1998-2      -2.19% 4   0.19% 5   0.38% 1   0.03% 2  -3.05% 3    -4.64%


 Avg         -0.85%     0.00%    -0.04%    -0.83%    -0.32%      -2.04%


 2002-2      -1.73% 2   2.49% 3   1.82% 4  -3.23% 5  -1.46% 1    -2.11%

 2006-2       0.88% 1   0.75% 2   0.02% 3   0.19% 4  -0.25% 5     1.60%

 2010-2       2.12% 5  -0.57% 1   0.49% 2  -0.26% 3  -0.31% 4     1.47%

 2014-2       0.78% 3  -1.62% 4   0.86% 5  -0.25% 1  -0.28% 2    -0.51%

 2018-2      -0.35% 1  -0.13% 2  -0.33% 3   0.28% 4   0.00% 5    -0.54%


 Avg          0.34%     0.18%     0.57%    -0.65%    -0.46%      -0.02%


SPX summary for PY2 1930 - 2018

Averages     -0.14%     0.02%     0.23%    -0.52%    -0.16%      -0.57%

% Winners       57%       52%       61%       35%       43%         48%

MDD  9/30/1974  8.47% --  9/30/1930  7.56% --  9/30/2002  4.64%


SPX summary for all years 1928 - 2021

Averages     -0.17%    -0.08%     0.06%    -0.22%     0.00%      -0.41%

% Winners       47%       46%       56%       52%       46%         49%

MDD 9/30/1931  11.08% --  9/29/2008  8.79% --  9/30/1974  8.47%
Conclusion
The Fed raised rates and is trimming their balance sheet by over 100b a month. There is not much to be positive about.
The strongest sectors last week were Banks and Health care (same as last week) while the weakest were Transportation and Internet.
I expect the major averages to be lower on Friday, September 30 than they were on Friday, September 23.
More By This Author:
Technical Market Report For September 17, 2022
Technical Market Report For September 10, 2022
Technical Market Report For September 3, 2022


Comments
Log in or sign up to join the conversation.