
Technical Market Report For Saturday, Oct. 2
Technical Market Report for Saturday, Oct. 2, 2021
The good news is that the market is ready to start the run for the roses.
The Negatives
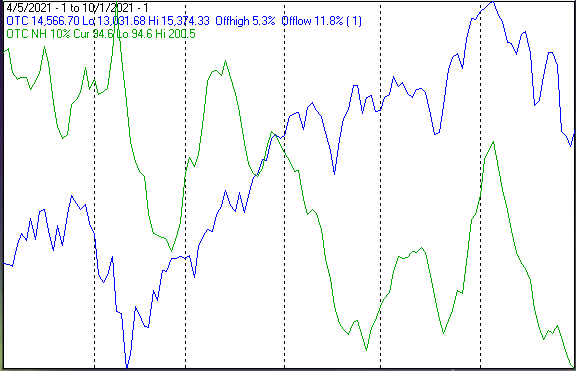
The first chart covers the past six months, showing the Nasdaq composite (OTC) in blue and a 10% trend (19-day EMA) of Nasdaq new highs (OTC NH) in green. Dashed vertical lines have been drawn on the first trading day of each month. The OTC NH is at its lowest point in nearly a year.
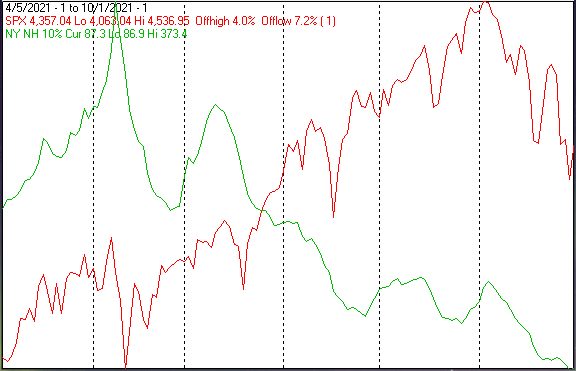
The next chart is similar to the first one, except it shows the S&P 500 (SPX) in red the and NY NH in green. The NY NH information has been calculated with NYSE data. Similar action was seen in the NY NH.
The Positives
The reason for my exuberance is that there was a price low five to six weeks ago, and another one was seen last Thursday. In the following charts, the indicators are all above their levels at the previous price low, five to six weeks ago. Also, the secondaries have been outperforming the blue chips.
The next chart covers the past six months, showing the OTC in blue and a 10% trend (19-day EMA) of Nasdaq new lows (OTC NL) in brown. The OTC NL has been plotted on an inverted Y axis, so decreasing numbers of new lows move the indicator upward (up is good). The OTC NL is well above its level of the previous price low, a non-confirmation.

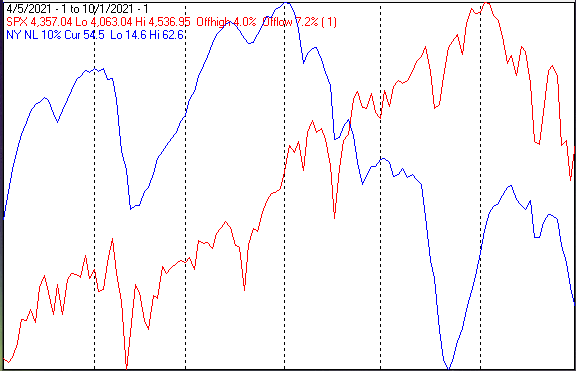
The next chart is similar to the one above, except is shows the SPX in red the and NY NL in blue. The NY NL information has been calculated with NYSE data. The SPX is significantly lower that it was five to six weeks ago, yet the NY NL is higher than it was on the previous dip; a non-confirmation.
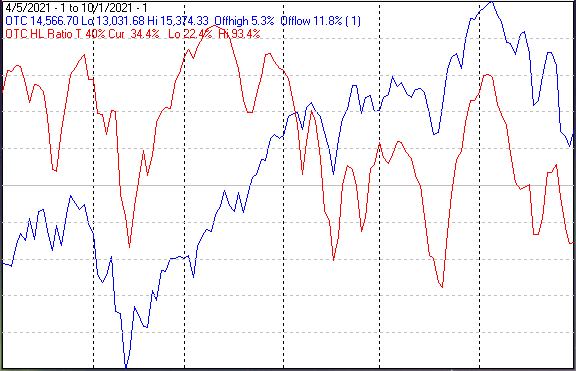
The next chart covers the past six months, showing the OTC in blue, and a 40% trend (four-day EMA) of Nasdaq new highs divided by new highs + new lows (OTC HL Ratio) in red. Dashed horizontal lines have been drawn at 10% levels for the indicator; the line is solid at the 50%, neutral level. The OTC HL Ratio finished the week in negative territory, but it is higher than it was five to six weeks ago, a non-confirmation.
The next chart is similar to the previous one, except it shows the SPX in red and the NY HL Ratio in blue. The NY HL Ratio information has been calculated with NYSE data. The NY HL Ratio is not only higher that it was five to six weeks ago, but it is also higher than it was about a week ago when prices were higher; a non-confirmation.

Seasonality
Next week includes the five trading days prior to the second Friday of October during the first year of the Presidential Cycle. The tables below show the daily change on a percentage basis for that period.
OTC data covers the period from 1963 to 2020, while SPX data runs from 1953 to 2020. There are summaries for both the first year of the Presidential Cycle and all years combined. Prior to 1953 the market traded six days a week, so that data has been ignored.
Average returns for the coming week have been mixed. The number following the year is the position in the Presidential Cycle.
OTC Presidential Year 1 (PY1)
Year Mon Tue Wed Thur Fri Totals
1965-1 -0.17% 0.30% 0.09% 0.21% 0.34% 0.77%
1969-1 -0.13% 0.38% -0.40% 0.14% -0.20% -0.21%
1973-1 0.54% -0.09% -0.80% 1.24% 0.48% 1.37%
1977-1 0.07% -0.45% -1.38% -0.80% 0.02% -2.55%
1981-1 0.84% -0.02% 1.57% 1.18% 0.14% 3.70%
1985-1 -0.77% -0.49% 0.48% 0.41% 0.84% 0.47%
1989-1 0.43% -0.33% -0.41% 0.01% -3.09% -3.39%
1993-1 0.21% -0.34% 0.33% -0.30% 0.23% 0.14%
1997-1 0.35% 0.89% 0.26% 0.23% -0.39% 1.34%
Avg: 0.21% -0.06% 0.45% 0.31% -0.45% 0.45%
2001-1 0.04% -2.23% 3.57% 4.62% 0.11% 6.12%
2005-1 -0.55% -0.86% -1.15% 0.48% 0.86% -1.21%
2009-1 0.98% 1.71% 0.32% 0.64% 0.72% 4.38%
2013-1 -0.98% -2.00% -0.46% 2.26% 0.83% -0.36%
2017-1 -0.16% 0.11% 0.25% -0.18% 0.22% 0.24%
Avg: -0.13% -0.65% 0.51% 1.56% 0.55% 1.83%
OTC Summary for PY1 1965 - 2017
- Avg: 0.05% -0.24% 0.16% 0.72% 0.08% 0.77%
- Win%: 57% 36% 57% 79% 79% 64%
OTC Summary for All Years 1963 - 2020
- Avg: 0.00% -0.41% -0.07% 0.18% 0.54% 0.25%
- Win%: 57% 45% 51% 67% 72% 57%
SPX PY1
Year Mon Tue Wed Thur Fri Totals
1953-1 -0.47% -0.38% 0.81% 0.17% 0.17% 0.30%
1957-1 -1.33% -0.64% 0.10% -2.45% -0.05% -4.38%
1961-1 -0.04% 0.25% 0.09% -0.01% -0.18% 0.10%
1965-1 0.20% 0.61% -0.10% -0.08% 0.42% 1.05%
1969-1 0.18% -0.29% -0.45% 0.39% 0.57% 0.40%
1973-1 0.35% -0.09% -0.83% 1.71% 0.32% 1.46%
1977-1 -0.23% -0.86% -0.94% -0.62% 0.11% -2.53%
Avg: 0.09% -0.08% -0.45% 0.28% 0.25% 0.10%
1981-1 0.13% -0.10% 1.61% 0.82% -0.70% 1.75%
1985-1 -0.74% 0.00% 0.36% 0.14% 0.82% 0.58%
1989-1 0.28% -0.19% -0.60% -0.45% -6.12% -7.06%
1993-1 0.01% -0.03% -0.10% -0.34% 0.25% -0.21%
1997-1 0.79% 1.07% -0.94% -0.33% -0.38% 0.22%
Avg: 0.10% 0.19% 0.07% -0.03% -1.23% -0.94%
2001-1 -0.83% -0.54% 2.29% 1.52% -0.53% 1.92%
2005-1 -0.72% -0.21% -0.61% -0.07% 0.83% -0.78%
2009-1 1.49% 1.37% 0.27% 0.75% 0.56% 4.44%
2013-1 -0.85% -1.23% 0.06% 2.18% 0.63% 0.79%
2017-1 -0.18% 0.23% 0.18% -0.17% 0.09% 0.15%
Avg: -0.22% -0.07% 0.44% 0.84% 0.32% 1.30%
SPX Summary for PY1 1953 - 2017
- Avg: -0.12% -0.06% 0.07% 0.19% -0.19% -0.11%
- Win%: 47% 31% 53% 47% 65% 71%
SPX Summary for All Years 1953 - 2020
- Avg: 0.13% -0.31% 0.13% -0.09% 0.20% 0.06%
- Win%: 54% 34% 51% 44% 59% 57%
Conclusion
It is currently difficult to find a positive opinion of the market, the economy, and the future in general. In other words, this is the perfect time for the market to begin a leap to new all-time highs. The numbers are lousy, but they are better than they were five to six weeks ago.
The strongest sectors last week were energy and banks, while the weakest were precious metals and electronics. I expect the major averages to be higher on Friday, Oct. 8 than they were on Friday, Oct. 1. Last week's positive forecast was a miss.


