
Technical Market Report For Saturday, March 26

The good news is:
- The market had another good week.
The negatives
- We are 2 weeks into this rally and new lows remain at threatening levels.
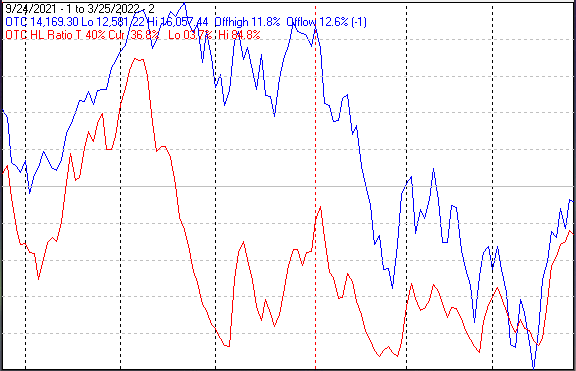
The first chart covers the past 6 months showing the Nasdaq composite (OTC) in blue and a 40% trend (4 day EMA) of Nasdaq new highs divided by new highs + new lows (OTC HL Ratio), in red. Dashed vertical lines have been drawn on the 1st trading day of each month and dashed horizontal lines have been drawn at 10% levels for the indicator; the line is solid at the 50%, neutral level.
OTC HL Ratio has been in negative territory for over 4 months.
The next chart is similar to the first one except it shows the S&P 500 (SPX) in red and NY HL ratio, in blue, has been calculated with NYSE data.
NY HL Ratio moved upward last week, but stopped at the neutral line.

The next chart covers the past 6 months showing the SPX in red and a 10% trend (19 day EMA) of NYSE new highs (NY NH) in green.
NY NH improved last week, but weak for an index close to its all time high.

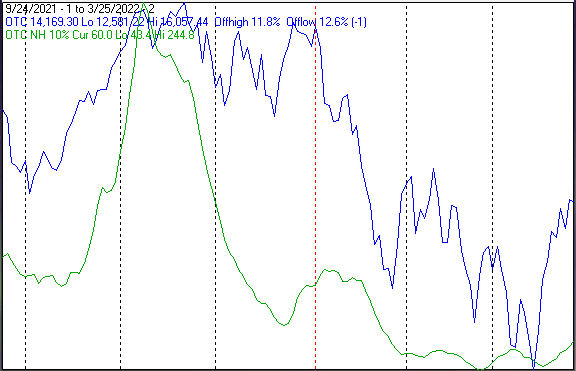
The next chart is similar to the one above except it shows the OTC in blue and OTC NH, in green, has been calculated with Nasdaq data.
Nothing encouraging here.
The next chart covers the past 6 months showing the SPX in red and a 10% trend (19 day EMA) of NYSE new lows (NY NL), in blue. NY NL has been plotted on an inverted Y axis so decreasing numbers of new lows move the indicator upward (up is good).
New lows declined again last week, but remained at uncomfortably high levels.

The next chart is similar to the previous one except it shows the OTC in blue and OTC NL, in brown, has been calculated with Nasdaq data.
Nasdaq new lows also declined last week, but remain in triple digits. When a bottom has been reached new lows disappear.

The Positives
This could be the start of a new uptrend.
Seasonality
Next week includes the last 4 trading days of March and the first trading day of April during the 2nd year of the Presidential Cycle. The tables below show the daily change, on a percentage basis, for that period.
OTC data covers the period from 1963 to 2020 while SPX data runs from 1928 to 2020. There are summaries for both the 2nd year of the Presidential Cycle and all years combined.
Average returns for the coming week have been modest and mixed.
Report for the last 4 days of March and first day of April.

The number following the year represents its position in the Presidential Cycle.

The number following the daily return represents the day of the week;

1 = Monday, 2 = Tuesday etc.


OTC Presidential Year 2 (PY2)

               Day4      Day3      Day2      Day1      Day1      Totals

 1966-2       0.49% 1   0.24% 2  -0.27% 3  -0.83% 4   0.41% 5     0.04%

 1970-2       0.46% 3   1.66% 4   0.15% 1  -0.03% 2   0.52% 3     2.76%

 1974-2      -0.08% 2  -1.11% 3  -1.42% 4  -0.65% 5  -0.40% 1    -3.67%

 1978-2       0.36% 2   0.38% 3   0.09% 4   0.02% 5  -0.29% 1     0.56%


 1982-2      -0.36% 5   0.17% 1  -0.05% 2   0.13% 3   0.95% 4     0.84%

 1986-2      -0.38% 2   0.36% 3   0.73% 4   0.38% 1  -0.15% 2     0.94%

 1990-2       0.15% 2  -0.64% 3  -0.29% 4   0.03% 5  -0.54% 1    -1.29%

 1994-2      -1.40% 1  -2.23% 2  -1.37% 3  -0.19% 4  -2.16% 1    -7.35%

 1998-2       0.25% 4  -0.27% 5  -0.27% 1   0.93% 2   0.65% 3     1.30%


 Avg         -0.35%    -0.52%    -0.25%     0.26%    -0.25%      -1.11%


 2002-2      -2.10% 1   0.64% 2   0.14% 3   1.02% 4   0.94% 1     0.64%

 2006-2      -0.48% 2   1.45% 3   0.13% 4  -0.04% 5  -0.13% 1     0.92%

 2010-2      -0.10% 5   0.39% 1   0.26% 2  -0.53% 3   0.19% 4     0.22%

 2014-2      -1.43% 3  -0.54% 4   0.11% 5   1.04% 1   1.64% 2     0.82%

 2018-2       3.25% 1  -2.92% 2  -0.85% 3   1.64% 4  -2.73% 1    -1.61%


 Avg         -0.17%    -0.20%    -0.04%     0.62%    -0.02%       0.20%


OTC summary for PY2 1966 - 2018

Averages     -0.10%    -0.17%    -0.21%     0.21%    -0.08%      -0.35%

% Winners       43%       57%       50%       57%       50%         71%

MDD  4/4/1994  7.15% --  4/2/2018  4.83% --  4/1/1974  3.62%


OTC summary for all years 1963 - 2021

Averages      0.17%    -0.26%     0.01%     0.18%    -0.06%       0.05%

% Winners       49%       54%       59%       64%       53%         64%

MDD 4/3/2000  14.82% --  4/2/2001  9.60% --  4/4/1994  7.15%


Year  2

               Day4      Day3      Day2      Day1      Day1      Totals

 1930-2      -0.20% 4   1.14% 5   0.80% 6   0.36% 1   0.91% 2     3.02%

 1934-2      -2.71% 2   0.29% 3   1.63% 4   1.22% 6   0.09% 1     0.52%

 1938-2       0.76% 1  -5.83% 2  -1.26% 3  -1.39% 4   4.82% 5    -2.89%


 1942-2      -0.98% 5   0.00% 6   0.12% 1  -0.62% 2   0.50% 3    -0.98%

 1946-2      -0.61% 3  -0.11% 4   0.61% 5   0.22% 6  -0.11% 1     0.00%

 1950-2       0.40% 2  -0.51% 3  -0.80% 4  -0.06% 5   0.29% 6    -0.68%

 1954-2       0.53% 5   0.38% 1   0.11% 2   0.94% 3   0.85% 4     2.81%

 1958-2      -0.33% 3  -0.31% 4   0.07% 5  -0.24% 1  -0.40% 2    -1.21%


 Avg         -0.20%    -0.11%     0.02%     0.05%     0.23%      -0.01%


 1962-2      -0.27% 2   0.49% 3  -0.04% 4  -0.66% 5  -0.26% 1    -0.74%

 1966-2       0.09% 1  -0.39% 2  -0.55% 3   0.51% 4   0.80% 5     0.45%

 1970-2       2.03% 3   0.17% 4  -0.32% 1   0.00% 2   0.49% 3     2.37%

 1974-2       0.32% 2  -1.39% 3  -1.83% 4  -0.89% 5  -0.78% 1    -4.57%

 1978-2       0.71% 2   0.16% 3  -0.26% 4  -0.22% 5  -0.84% 1    -0.46%


 Avg          0.58%    -0.19%    -0.60%    -0.25%    -0.12%      -0.59%


 1982-2      -1.12% 5   0.32% 1  -0.03% 2  -0.28% 3   1.63% 4     0.53%

 1986-2      -0.26% 2   1.10% 3   0.70% 4  -0.03% 1  -1.57% 2    -0.06%

 1990-2       1.15% 2   0.15% 3  -0.35% 4  -0.25% 5  -0.36% 1     0.32%

 1994-2      -0.13% 1  -1.63% 2  -1.53% 3   0.05% 4  -1.54% 1    -4.78%

 1998-2      -0.10% 4  -0.49% 5  -0.17% 1   0.75% 2   0.58% 3     0.57%


 Avg         -0.09%    -0.11%    -0.28%     0.05%    -0.25%      -0.68%


 2002-2      -1.47% 1   0.58% 2   0.53% 3   0.25% 4  -0.07% 1    -0.17%

 2006-2      -0.64% 2   0.75% 3  -0.20% 4  -0.42% 5   0.23% 1    -0.29%

 2010-2       0.07% 5   0.57% 1   0.00% 2  -0.33% 3   0.74% 4     1.06%

 2014-2      -0.70% 3  -0.19% 4   0.46% 5   0.79% 1   0.70% 2     1.07%

 2018-2       2.72% 1  -1.73% 2  -0.29% 3   1.38% 4  -2.23% 1    -0.16%


 Avg          0.00%     0.00%     0.10%     0.33%    -0.13%       0.30%


SPX summary for PY2 1930 - 2018

Averages     -0.03%    -0.28%    -0.11%     0.05%     0.19%      -0.19%

% Winners       43%       52%       43%       43%       57%         48%

MDD  3/31/1938  8.31% --  4/1/1974  4.80% --  4/4/1994  4.70%


SPX summary for all years 1928 - 2021

Averages      0.10%    -0.10%     0.02%    -0.12%     0.11%       0.02%

% Winners       49%       52%       47%       44%       62%         54%

MDD 3/31/1939  8.42% --  3/31/1938  8.31% --  4/1/1932  7.24%
Conclusion
This continues to look like a counter trend, bear market, rally because, although they have decreased, new lows have remained at very high levels. After a real bottom new lows quickly disappear.
The strongest sectors last week were Utilities and Energy (both up from the bottom last week) while the weakest were Banks and Retail (down from the top last week.
I expect the major averages to be lower on Friday April 1 than they were on Friday March 25.
Last week the Russell 2000 was down while the other major indices were up so I am calling last week's negative forecast a tie.


