
The good news is:
- At the current rate of new low accumulation, this period of weakness should be over soon.
The Negatives
The Russell 2000 (R2K) is leading the way downward.
Except for last Tuesday when there were 99 new lows on the NYSE, new lows were well into triple digits, every day, on both the NYSE and Nasdaq.
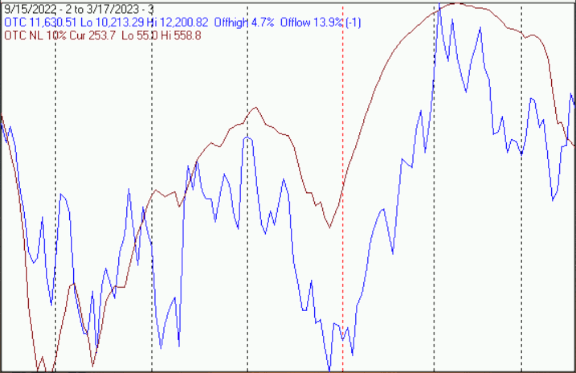
The first chart covers the past 6 months showing the Nasdaq composite (OTC) in blue and a 40% trend (4 day EMA) of Nasdaq new highs divided by new highs + new lows (OTC HL Ratio), in red. Dashed vertical lines have been drawn on the first trading day of each month. Dashed horizontal lines have been drawn at 10% levels for the indicator; the line is solid at the 50%, neutral level (equal numbers of new highs and new lows).
OTC HL Ratio remained deeply in negative territory.

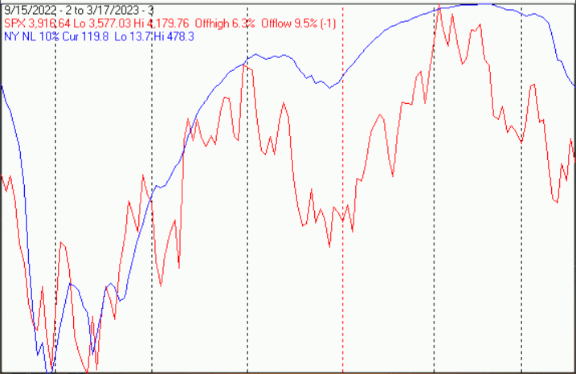
The next chart is similar to the one above except it shows the S&P 500 (SPX) in red and NY HL ratio, in blue, has been calculated with NYSE data.
NY HL ratio fell deep into negative territory.

The next chart covers the last 6 months showing the OTC in blue and a 10% trend (19 day EMA) of Nasdaq new lows (OTC NL) in brown. OTC NL has been plotted on an inverted Y axis so decreasing numbers of new lows move the indicator upward (up is good).
OTC NL and the NYSE version of it are the best indicators I have of cycle bottoms.
OTC NL continued moving sharply downward last week.
The next chart is similar to the one above except it shows the SPX in red and NY NL, in blue, has been calculated with NYSE data.
NY NL also moved sharply downward.
The Positives
Max on FX Evolution pointed out that last Thursday’s rally brought the SPY (SPX equivalent), on which millions of option contracts are traded, up to the point of “Max Pain” t- he point at which most option buyers lose the most money.
Seasonality
Next week includes the last 5 trading days prior to the 4th Friday of March during the 3rd year of the Presidential Cycle. The tables below show the daily change, on a percentage basis for that period.
OTC data covers the period from 1963 to 2021 while SPX data runs from 1953 to 2021. There are summaries for both the 3rd year of the Presidential Cycle and all years combined. Prior to 1953 the market traded 6 days a week, so that data has been ignored.
Average returns for the coming week have been modestly positive by all measures.
Report for the week before the 4th Friday of March.
The number following the year is the position in the Presidential Cycle.
Daily returns from Monday through the 4th Friday.
OTC Presidential Year 3 (PY3)

 Year       Mon     Tue     Wed    Thur    Fri    Totals

 1963-3   0.39%  -0.29%  -0.13%   0.35%   0.06%   0.39%

 1967-3   0.66%   0.16%   0.69%   0.20%   0.32%   2.04%

 1971-3  -0.38%  -0.25%  -0.39%  -0.10%   0.45%  -0.66%

 1975-3   0.00%   0.00%   0.00%   0.00%   0.00%   0.00%

 1979-3   0.46%  -0.27%   0.50%   0.49%   0.38%   1.57%


 Avg      0.28%  -0.16%   0.17%   0.24%   0.30%   0.83%


 1983-3   0.50%   0.45%   0.65%   0.41%   0.19%   2.20%

 1987-3  -0.36%   0.02%  -0.15%   0.28%  -0.42%  -0.63%

 1991-3   0.00%  -0.74%   0.71%  -0.32%  -0.10%  -0.45%

 1995-3   0.27%  -0.09%  -0.08%   0.28%   0.90%   1.27%

 1999-3  -1.06%  -3.05%   1.83%   2.94%  -0.64%   0.02%


 Avg     -0.13%  -0.68%   0.59%   0.72%  -0.02%   0.48%


 2003-3  -3.66%   1.55%  -0.26%  -0.23%  -1.06%  -3.66%

 2007-3   0.92%   0.58%   1.98%  -0.17%  -0.11%   3.19%

 2011-3   1.83%  -0.31%   0.54%   1.41%   0.24%   3.72%

 2015-3  -0.31%  -0.32%  -2.37%  -0.27%   0.57%  -2.70%

 2019-3   0.34%   0.12%   0.06%   1.42%  -2.50%  -0.56%


 Avg     -0.18%   0.32%  -0.01%   0.43%  -0.57%   0.00%


OTC summary for PY3 1963 - 2019

 Avg     -0.03%  -0.17%   0.26%   0.48%  -0.12%   0.41%

 Win%       57%     43%     57%     64%     57%     57%


OTC summary for all years 1963 - 2022

 Avg     -0.01%  -0.03%   0.00%   0.28%  -0.10%   0.12%

 Win%       50%     44%     50%     56%     52%     54%


SPX PY3

 Year       Mon     Tue     Wed    Thur    Fri    Totals

 1955-3  -0.64%   0.61%   1.30%   0.79%   0.08%   2.15%

 1959-3   0.00%   0.00%   0.00%   0.00%   0.00%   0.00%


 1963-3  -0.49%  -0.21%   0.73%  -0.15%   0.52%   0.40%

 1967-3  -0.08%   0.04%  -0.20%  -0.03%  -0.55%  -0.82%

 1971-3  -0.39%  -0.34%  -0.66%  -0.01%   0.34%  -1.05%

 1975-3   0.00%   0.00%   0.00%   0.00%   0.00%   0.00%

 1979-3   0.37%  -0.55%   0.75%   0.41%  -0.07%   0.91%


 Avg     -0.15%  -0.27%   0.16%   0.06%   0.06%  -0.14%


 1983-3   0.86%  -0.35%   1.43%   0.37%  -0.46%   1.85%

 1987-3   1.00%   0.16%  -0.42%   0.18%  -1.60%  -0.67%

 1991-3  -0.40%  -1.48%   0.36%  -0.36%   0.25%  -1.64%

 1995-3   0.13%  -0.22%   0.12%   0.06%   1.01%   1.10%

 1999-3  -0.18%  -2.69%   0.52%   1.69%  -0.56%  -1.22%


 Avg      0.28%  -0.92%   0.40%   0.39%  -0.27%  -0.12%


 2003-3  -3.52%   1.22%  -0.55%  -0.16%  -0.58%  -3.60%

 2007-3   1.09%   0.63%   1.71%  -0.03%   0.11%   3.51%

 2011-3   1.50%  -0.36%   0.29%   0.93%   0.32%   2.69%

 2015-3  -0.17%  -0.61%  -1.46%  -0.24%   0.24%  -2.25%

 2019-3   0.37%  -0.01%  -0.29%   1.09%  -1.90%  -0.75%


 Avg     -0.15%   0.17%  -0.06%   0.32%  -0.36%  -0.08%


SPX summary for PY3 1955 - 2019

 Avg     -0.04%  -0.28%   0.24%   0.30%  -0.19%   0.04%

 Win%       47%     33%     60%     53%     53%     47%


SPX summary for all years 1953 - 2022

 Avg      0.00%   0.03%   0.04%   0.09%  -0.15%   0.02%

 Win%       41%     46%     43%     43%     53%     39%
Money supply (M2) and Interest Rates
The following charts were supplied by Gordon Harms.
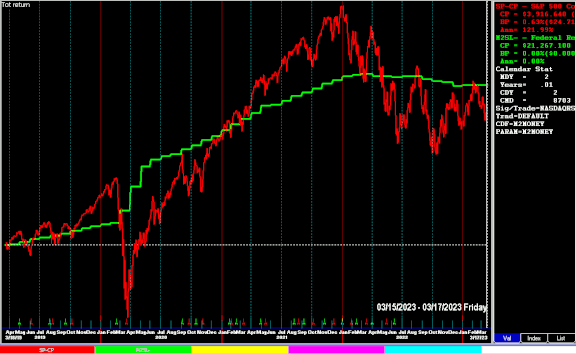
The first chart, made with FastTrack, covers the past 5 years showing the SPX in red and M2 money supply in green.
Money supply has been declining slowly since late 2021.
Treasury rates at their close last Friday and their changes from last month:
- 2yr yield 3.825% down from 4.630%
- 5yr yield 3.510% down from 4.034%
- 10yr yield 3.430% down from 3.822%
- 30yr yield 3.628% down from 3.871%
Everything is inverted (shorter term maturities yield more than longer term maturities) except the 30 year to the 10 year and 5 year (same as last month).
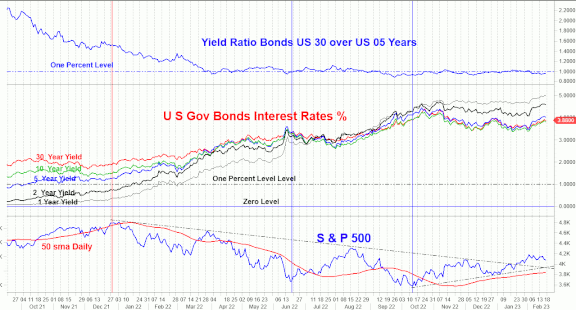
The next chart covers the past 15 months showing the 30 year yield over the 5 year yield on top, The 1, 2, 5, 10 & 30 year treasury rates in the middle group and the SPX with a 50 day simple moving average on the bottom.
Conclusion
New lows are at bear market levels and the secondaries are leading the way downward.
The strongest sectors last week were Precious Metals and Utilities while the weakest were Energy and Basic Materials (for the 2nd week).
I expect the major averages to be lower on Friday, March 24 than they were on Friday, March 17.
Last week the Dow Jones Industrial Average and the R2K were down while the OTC and SPX were up so I am calling last week's negative forecast a tie.
More By This Author:
Technical Market Report For March 11, 2023
Technical Market Report For March 4, 2023
Technical Market Report For February 25, 2023


Comments
Log in or sign up to join the conversation.