

The good news is:
- The market has had a remarkable rally.
The Negatives
Hopes for a continuing rally diminished last Friday when all of the major indices fell over 3% and new lows increased to threatening levels.
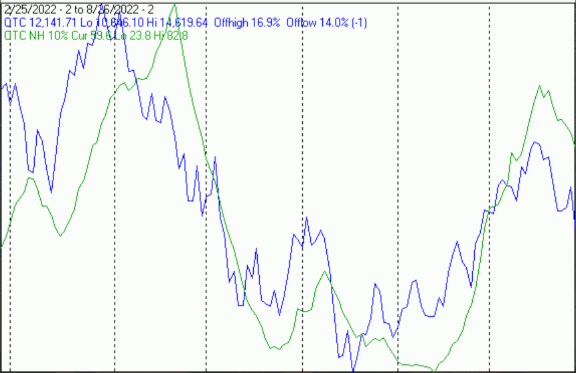
The first chart covers the last 6 months showing the Nasdaq composite (OTC) in blue and a 10% trend (19 day EMA) of Nasdaq new highs in green.
OTC NH declined from an already low level.
The next chart is similar to the one above except it shows the S&P 500 (SPX) in red and NY NH has been calculated with NYSE data.
NY NH leveled off at a very low level.

The next chart covers the past 6 months showing the OTC in blue and a 40% trend (4 day EMA) of Nasdaq new highs divided by new highs + new lows (OTC HL Ratio), in red. Dashed vertical lines have been drawn on the 1st trading day of each month. Dashed horizontal lines have been drawn at 10% levels for the indicator; the line is solid at the 50%, neutral level (equal numbers of new highs and new lows).
OTC HL Ratio continued its downward move into negative territory.

The next chart is similar to the previous one except it shows the SPX in red and NY HL ratio, in blue, has been calculated with NYSE data.
NY HL Ratio also went negative,

The next chart covers the past 6 months showing the SPX in red and a 10% trend (19 day EMA) of NYSE new lows (NY NL), in blue. NY NL has been plotted on an inverted Y axis so decreasing numbers of new lows move the indicator upward (up is good).
NY NL turned downward. On the bright side it did not turn sharply downward.

The next chart is similar to the previous one except it shows the OTC in blue and OTC NL, in brown, has been calculated with Nasdaq data.
OTC NL ditto.

The Positives
Not much to say here. All the breadth indicators headed south for the 1st time since early June.
Seasonality
Next week includes the last 3 trading days of August and the first 2 trading days of September during the 2nd year of the Presidential Cycle. The tables below show the daily change, on a percentage basis for that period
OTC data covers the period from 1963 to 2021 while SPX data runs from 1928 to 2021. There are summaries for both the 2nd year of the Presidential Cycle and all years combined.
Average returns for the coming week have been mixed, modestly positive over all years and negative during the 2nd year of the Presidential Cycle.
Report for the last 3 days of August and first 2 days of September.

The number following the year represents its position in the Presidential Cycle.

The number following the daily return represents the day of the week;

1 = Monday, 2 = Tuesday etc.


OTC Presidential Year 2 (PY2)

               Day3      Day2      Day1      Day1      Day2      Totals

 1966-2      -2.56% 1  -2.71% 2   0.73% 3   1.44% 4  -0.23% 5    -3.34%

 1970-2      -0.05% 4   1.15% 5   0.64% 1   0.00% 2  -0.80% 3     0.93%

 1974-2       0.14% 3  -1.70% 4   1.63% 5  -2.39% 2  -3.17% 3    -5.48%

 1978-2      -0.45% 2   0.09% 3   0.19% 4   0.25% 5   0.82% 2     0.90%


 1982-2      -0.32% 5  -0.70% 1   0.77% 2  -0.23% 3   1.24% 4     0.76%

 1986-2       0.32% 3   0.19% 4   0.12% 5  -0.71% 2  -0.33% 3    -0.42%

 1990-2      -0.28% 3  -0.81% 4   0.67% 5   0.12% 2   0.20% 3    -0.10%

 1994-2       0.04% 1   0.43% 2  -0.11% 3  -0.87% 4   0.04% 5    -0.48%

 1998-2      -4.63% 4  -2.77% 5  -8.57% 1   5.06% 2   1.12% 3    -9.79%


 Avg         -0.98%    -0.73%    -1.42%     0.67%     0.45%      -2.01%


 2002-2      -2.48% 3   1.63% 4  -1.57% 5  -3.88% 2   2.25% 3    -4.04%

 2006-2       0.54% 2   0.62% 3  -0.09% 4   0.43% 5   0.57% 2     2.07%

 2010-2       1.65% 5  -1.56% 1  -0.28% 2   2.97% 3   1.06% 4     3.84%

 2014-2      -0.02% 3  -0.26% 4   0.50% 5   0.39% 2  -0.56% 3     0.05%

 2018-2       0.99% 3  -0.26% 4   0.26% 5  -0.23% 2  -1.19% 3    -0.42%


 Avg          0.14%     0.03%    -0.24%    -0.06%     0.43%       0.30%


OTC summary for PY2 1966 - 2018

Averages     -0.51%    -0.48%    -0.37%     0.17%     0.07%      -1.11%

% Winners       43%       43%       64%       50%       57%         43%

MDD  8/31/1998  15.22% --  9/3/2002  6.23% --  9/4/1974  5.57%


OTC summary for all years 1963 - 2021

Averages      0.15%    -0.06%     0.11%     0.03%     0.10%       0.34%

% Winners       64%       63%       69%       60%       63%         64%

MDD 8/31/1998  15.22% --  9/3/2002  6.23% --  9/5/2001  5.68%


SPX PY2

               Day3      Day2      Day1      Day1      Day2      Totals

 1930-2       0.76% 3  -0.05% 4   1.14% 5   0.05% 2  -0.98% 3     0.92%

 1934-2      -0.86% 3  -1.08% 4  -0.11% 5  -0.22% 6  -0.77% 2    -3.03%

 1938-2      -4.20% 1   1.60% 2   0.17% 3  -1.16% 4   2.85% 5    -0.74%


 1942-2       0.23% 5   0.12% 6   0.00% 1   0.00% 2   0.12% 3     0.46%

 1946-2      -1.12% 3   0.18% 4  -0.66% 5  -6.73% 2  -0.45% 3    -8.78%

 1950-2       0.05% 2  -0.59% 3  -0.05% 4   0.71% 5   0.70% 2     0.81%

 1954-2       0.29% 5  -1.01% 1  -1.71% 2   0.70% 3   0.77% 4    -0.96%

 1958-2       0.02% 3  -0.52% 4   0.19% 5   0.52% 2   0.38% 3     0.59%


 Avg         -0.10%    -0.37%    -0.45%    -0.96%     0.30%      -1.57%


 1962-2      -0.22% 3   0.03% 4   0.75% 5  -0.95% 2  -0.75% 3    -1.14%

 1966-2      -2.46% 1   1.78% 2   1.63% 3   0.78% 4  -0.36% 5     1.38%

 1970-2      -0.16% 4   0.96% 5  -0.42% 1  -0.70% 2   0.01% 3    -0.30%

 1974-2      -0.25% 3  -1.09% 4   3.09% 5  -2.26% 2  -2.60% 3    -3.11%

 1978-2      -0.55% 2   0.11% 3  -0.20% 4   0.38% 5   0.78% 2     0.51%


 Avg         -0.73%     0.36%     0.97%    -0.55%    -0.58%      -0.53%


 1982-2      -1.21% 5   0.47% 1   1.57% 2  -1.05% 3   1.72% 4     1.49%

 1986-2       0.18% 3  -0.18% 4   0.04% 5  -1.74% 2   0.63% 3    -1.08%

 1990-2       0.89% 3  -1.69% 4   1.21% 5   0.16% 2   0.40% 3     0.97%

 1994-2       0.17% 1   0.32% 2  -0.12% 3  -0.49% 4  -0.46% 5    -0.59%

 1998-2      -3.84% 4  -1.48% 5  -6.78% 1   3.83% 2  -0.38% 3    -8.64%


 Avg         -0.76%    -0.51%    -0.82%     0.14%     0.38%      -1.57%


 2002-2      -1.81% 3  -0.01% 4  -0.19% 5  -4.15% 2   1.75% 3    -4.41%

 2006-2       0.19% 2   0.00% 3  -0.04% 4   0.55% 5   0.17% 2     0.88%

 2010-2       1.66% 5  -1.47% 1   0.04% 2   2.95% 3   0.91% 4     4.08%

 2014-2       0.00% 3  -0.17% 4   0.33% 5  -0.05% 2  -0.08% 3     0.04%

 2018-2       0.57% 3  -0.44% 4   0.01% 5  -0.17% 2  -0.28% 3    -0.31%


 Avg          0.12%    -0.42%     0.03%    -0.17%     0.49%       0.06%


SPX summary for PY2 1930 - 2018

Averages     -0.51%    -0.18%    -0.01%    -0.39%     0.18%      -0.91%

% Winners       52%       39%       52%       43%       57%         48%

MDD  8/31/1998  11.68% --  9/4/1946  8.63% --  9/3/2002  6.08%


SPX summary for all years 1928 - 2021

Averages      0.06%    -0.06%     0.11%    -0.07%     0.15%       0.20%

% Winners       66%       51%       61%       63%       55%         65%

MDD 8/31/1998  11.68% --  9/4/1946  8.63% --  9/3/2002  6.08%
Conclusion
The market was looking pretty good until Friday when all of the week’s gains were wiped out and all of the breadth indicators turned negative.
The strongest sectors last week were Energy and basic materials while the weakest were Financials and Health care.
I expect the major averages to be lower on Friday, September 2 than they were on Friday, August 26.
Last week's positive forecast was a miss.
More By This Author:
Technical Market Report For Aug. 20, 2022
Technical Market Report For August 13, 2022
Technical Market Report For Saturday, Aug. 6


Comments
Log in or sign up to join the conversation.