
Technical Analysis Of The Markets
Yikes! $450.3 million for Leonardo da Vinci’s “Salvator Mundi” sold on Wednesday night at Christie’s auction, shattering the high for any work of art sold at auction. It far surpassed Picasso’s “Women of Algiers” which fetched $179.4 million at Christie’s in May 2015. It also far surpassed the $127.5 million that Russian billionaire oligarch Dmitry E. Rybolovlev paid for it in 2013. In 1958, the painting sold for £45 because it was believed this was not an authentic da Vinci but merely one done by one of his students. In 2005, an art dealer purchased it for $10,000. There have been numerous questions surrounding its authenticity and the fact that it had at times been restored. The painting dates from around 1500 and is believed to have been commissioned for King Louis XII of France. The current buyer is unknown.
Bubbles, bubbles everywhere. There are bubbles in the stock market, the bond market, the corporate bond market, auto loans, student loans, real estate, government debt, art and collectibles, and yes, Bitcoin! But it also begs the question— why isn’t there a bubble in commodities and especially gold?
Fed Chairman Janet Yellen Blowing Bubbles
The finger is easy to point at the Fed and its fellow central banks, the ECB and the BOJ. Look at the years of artificially suppressed interest rates and quantitative easing (QE) that have resulted in producing only anemic economic growth but massive inflation of financial and other assets. A look at the massive growth in the assets of the major central banks tells the story.
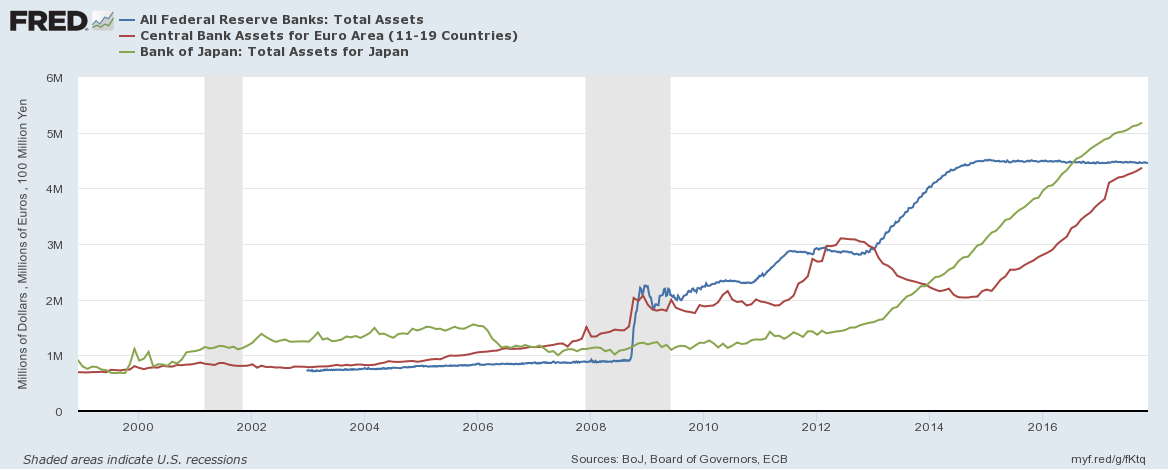
Source: www.stlouisfed.org
Since the end of 2007, the Fed’s balance sheet has ballooned by $3.6 trillion or 300%, the ECB’s balance sheet has shot up by €2.9 trillion or 190%, while the BOJ’s balance sheet has exploded by ¥406.7 trillion or 365%. Global debt has exploded as well. According to studies, global debt has grown from roughly $149 trillion in 2007 to about $217 trillion today (some show as high as $230 trillion) an increase of 46%. Global debt to GDP stands at around 327% with some countries such as Japan and the United Kingdom exceeding with a debt to GDP ratio in excess of 600% (Note: debt refers to all debt—governments, corporations, and households). The U.S. is at 332%.
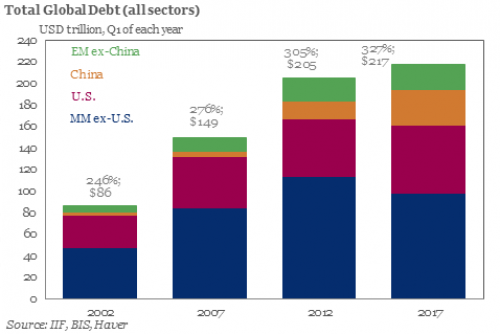
Source: www.iif.com, www.bis.org, www.haver.com
China has been the largest source of global debt growth. In 2007, Chinese debt (all debt) to GDP stood at around 150%. Today it is over 300%. China’s corporate sector has been the biggest source of growth. Emerging market debt has also grown rapidly with much of it borrowed in US$. Borrowing in US$ works well if the borrower’s home currency rises against the US$ but for many, it has been the opposite with their home currency falling sometimes sharply against the US$. That makes the debt borrowed in US$ even more expensive. Defaults could loom and that has become a constant worry.
But massive growth in debt has been seen in all sectors. As 2017 nears an end there has been a considerable rise in downgrades of debt from the rating agencies including S&P, Moody’s, and Fitch. All sectors have been impacted, both corporate and government. In the U.S., the Fed has issued warnings about sub-prime automobile loans and student debt. In Canada, the Bank of Canada has constantly issued warnings about the high level of household debt.
Massive growth in debt and central bank balance sheets have helped feed the bubbles. There is simply too much cash sloshing around the world. This helps inflate the assets. But is any of it being invested wisely? Hardly. The U.S. has spent an estimated $4.3 trillion on wars since 2003. Yet in the U.S. today all they talk about is tax cuts that will primarily benefit the wealthy and add more to the national debt. U.S. corporations have billions stashed overseas but it is not being invested. China seems to be putting some of their money to use through the Asian Infrastructure Bank, a bank being set up to rival the IMF and the World Bank. There is also China’s “New Silk Road” that will cross Asia into Europe. No wonder today that the U.S. sees China as the main threat to the U.S.’s global economic hegemony and the Chinese Yuan equally as a threat to US$ hegemony.
There is an old saying that you cannot borrow your way to prosperity. Yet that is exactly what we have done. And evidence of too much money sloshing around in the financial system was highlighted by this week’s sale of “Salvator Mundi.” It is a sign of excess. We live in an illusion of wealth backed by debt. All major depressions and financial crises have their basis in debt collapse. Is this time any different? We doubt it. It is a matter of when not if.
Bitcoin Watch!
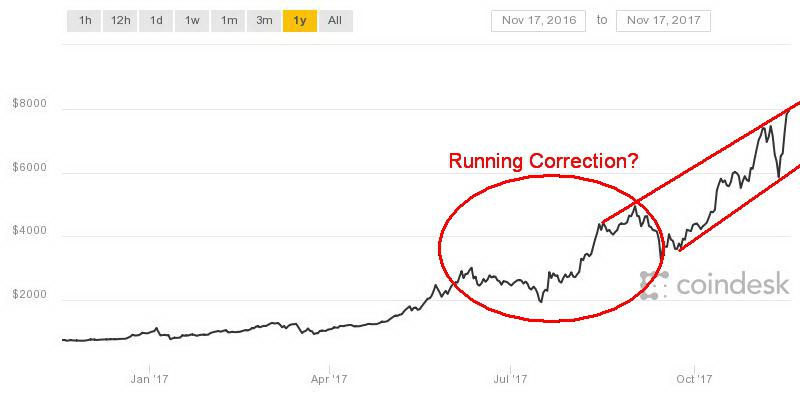
Source: www.coindesk.com
We are getting a headache. Yes, we are getting a headache watching Bitcoin. We are now suffering from severe whiplash following last week’s plunge that saw Bitcoin fall from $7,879 to $5,507 or 30% in the space of five days only to turn around and rise to a new record high of $7,998 or 45% five days later. Whew! Are you exhausted yet?
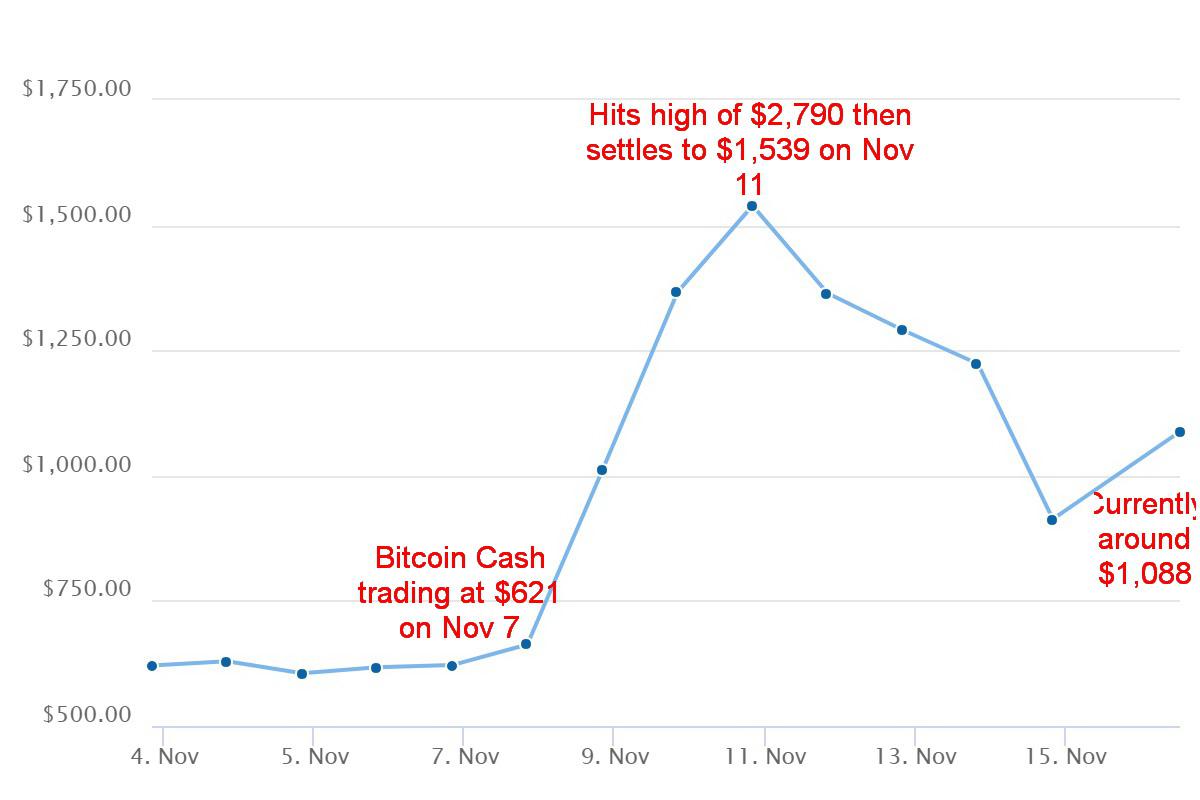
It is nearly impossible to become involved in such wild volatility. But obviously, somebody is. Last week’s plunge was supposedly precipitated by the shifting from Bitcoin to Bitcoin cash an offshoot or fork of Bitcoin and all over as to whether the fork that was promised was actually going to happen. It did and that precipitated the wild ride. Bitcoin cash apparently leaped from $600 to almost $2,800 before plunging all the way back to almost $900. All this was accomplished in the space of about 10 days. Is this rational? Is this normal?
Even sources were suggesting there was manipulation involved apparently out of Korea through an exchange called “Bithumb.” It seems that only in the mysterious world of cryptocurrencies can you have a name like the “Bithumb Exchange”. We are sure that someday there will be a movie about cryptocurrencies. If they can make “The Wolf of Wall Street” and “The Big Short,” surely someone will come up with “The Crypto King” or some such name. Apparently, the volume was so large on “Bithumb” that the servers crashed. No guff! Battle of the Bitcoin cryptos.
All one can say about this craziness is buyer beware. But is there a future for Bitcoin and other cryptocurrencies in this kind of “wild west” environment? Maybe, maybe not. We know regulators are tearing their hair out trying to figure out how to get control of this. But uses are also spreading oddly enough or maybe not so oddly in third world countries where few have faith in their own fiat currency or for that matter banks. To transfer Bitcoin or whatever cryptocurrency all they need is a cell phone. And in many third world countries, there are now more cell phones than bank accounts.
But scams and failures are going to be a major feature of cryptocurrencies. Recently a screw-up occurred when hackers broke into the cryptocurrency wallet of Ethereum. When they attempted to fix it a bug was released that unintentionally took control of a number of wallets. The result was the funds simply evaporated. Apparently, they couldn’t unlock it again. Total destruction: US$390 million. Poof—gone!
As we said—buyer beware. Indeed, it might not even be a wise idea to short sell. Headaches and whipsaws might follow.
Bitcoin Cash
Source: www.coingecko.com
Source: www.stockcharts.com
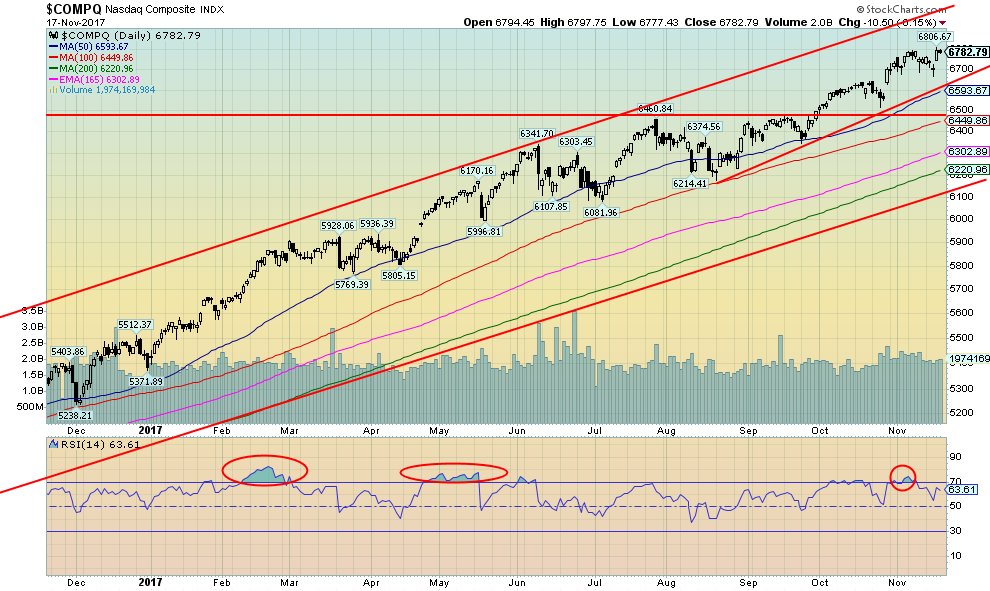
It’s lonely at the top. This past week the Nasdaq was only one of the major indices that made new all-time highs. The Nasdaq even managed to close higher on the week gaining about 0.5%. The Dow Jones Industrials (DJI ) dropped 0.3%, the S&P 500 was off 0.1% while the Dow Jones Transportations (DJT) fell 0.2%. None of them made new all-time highs and the DJT continues to diverge with the DJI. On the other hand, the Dow Jones Utilities (DJU) did gain just under 0.2%, spiking on Friday to a new all-time high and then reversing and closing barely up on the day. Oddly enough, the small cap Russell 2000 managed an up week with a 1.2% gain but failed to make a new all-time high. The Value Line Index spiked higher on Thursday/Friday along with the Nasdaq, but just fell short of a new all-time high. Most indices on the week were either putting in a small up week or a small down week. The catalyst to keeping the markets up was on one hand excitement over Congress getting the tax reform bill through but then they realized it might have trouble in the Senate so the markets gave back most of Thursday’s big up day on Friday. Two numbers stand out on the chart of the Nasdaq. The first is the low seen on November 15, 2017 at 6,667 then the low on October 25, 2017 at 6,517. A breakdown under 6,500 would most likely confirm a top for the Nasdaq. Our expectations, however, are that it might take some work to break under 6,500. New highs for the Nasdaq could suggest a run to 6,800.
Source: www.stockcharts.com
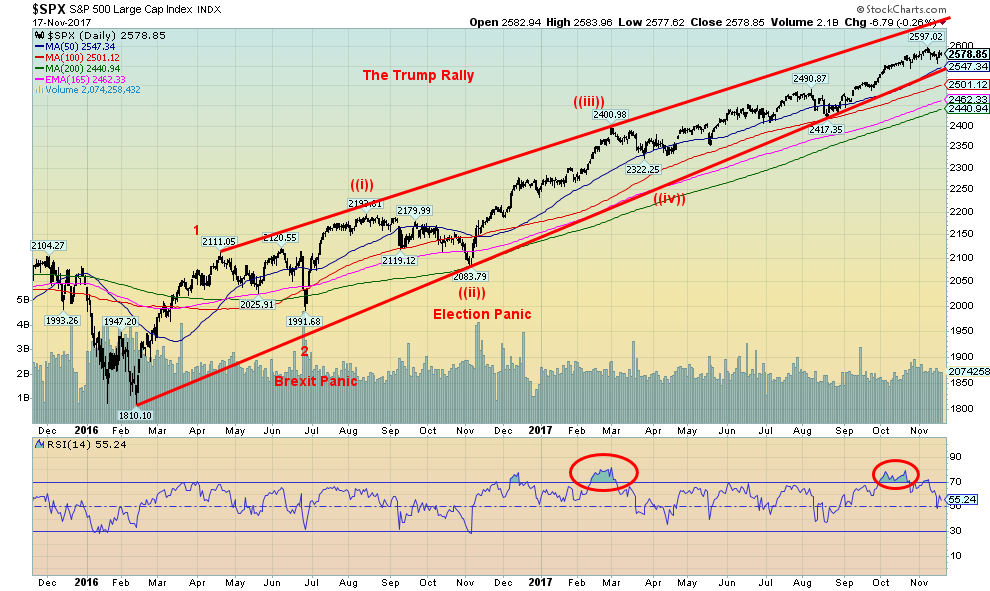
Here is our usual longer dated chart of the S&P 500 from the important February 2016 low that also shows the Brexit and election mini-panics. The climb continues and may yet again make new all-time highs. Just not this past week as the tax reform bill weighed on markets. A breakdown under $2,550 could signal that at least a temporary top is in. But we would need a breakdown under 2,400 to confirm that a bear market correction was under way. Our next potential target higher is 2,658. At 2,597, we are just short of that target zone. Naturally, failure to achieve target zones is a potential sign that a top might be in. A breakdown under 2,550 would go some distance in confirming a top.

Source: www.stockcharts.com
The Dow Jones Industrials (DJI ) may be making a small head and shoulders top. Naturally, this is not yet confirmed. A breakdown under 23,250 (the neckline) could suggest a decline to at least 22,890. The 50-day MA is currently at 22,922 so the target zone is fitting. A more serious breakdown would get underway below 21,600. At this stage, there is no expectation of that occurring but it cannot be dismissed. Unlike the S&P 500, the DJI has achieved its next target at 23,175. Achieving targets and now exceeding that target could suggest that the next target zone of 26,280 could be next. But we are jumping ahead of ourselves. A test of the 50-day MA is overdue.
Source: www.stockcharts.com
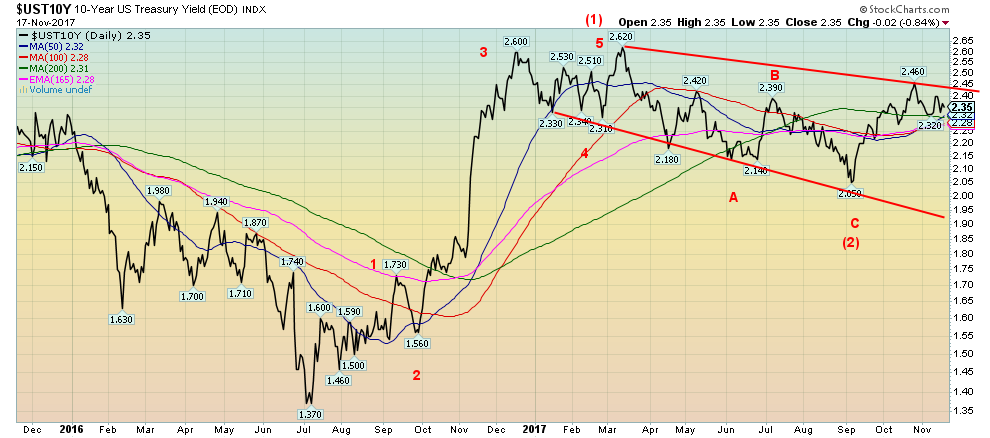
We continue to believe the 10-year US Treasury note is headed higher to at least 3%. This despite the recent stall-out that has occurred at 2.46%. We are currently at 2.35% as of Friday. What seems to be happening here is the 10 -year is testing the 200-day MA and just below that is the converging 50 and 100-day MA along with the 165-day EMA. The 50-day MA is poised to cross over the 200-day MA to the upside. Only a breakdown under 2.20% might suggest lower yields ahead and a test of 1.95% to 2.00%.
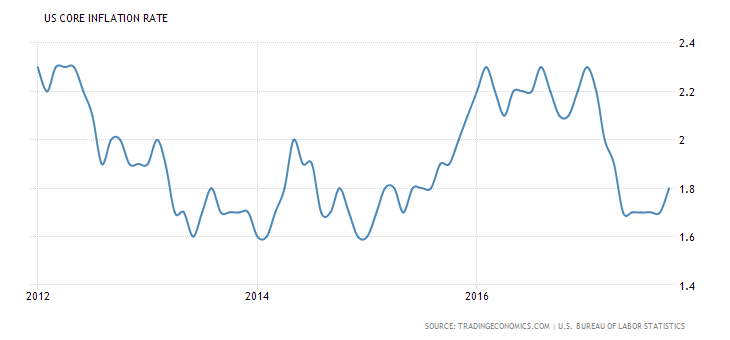
Source: www.tradingeconomics.com, www.bls.gov
The annual core inflation rate for October 2017 jumped to 1.8%. This was somewhat unexpected following a number of months where the rate hovered around 1.6%. Food, transportation services, and medical care accounted for most of the rise. At 1.8%, it is closer to the Fed’s 2% target. The jump in the core inflation also increases the odds that the Fed will hike interest rates at the December FOMC meeting.

Source: www.stockcharts.com
Is the recent US$ rally over? It appears it might be. Still, there remains the threat of higher interest rates at the December FOMC and passage of the tax reform bill would be positive for the US$. But the rally from the September low of 90.99 appears to have unfolded as an abc type correction. The low at 92.59 seen in October remains but if that breaks then the US$ Index is headed lower. The US$ was lower this past week against the Euro, the Pound, and the Yen but higher against the Cdn$. Right now the US$ Index is hanging on the 50/100 day MA but a break of 93.30 would send the US$ Index tumbling towards the October 92.59 low. New lows below 90.99 could suggest targets down to 87. Only new highs above 95.07 would constitute an upside breakout and a possible run to 96.50.

Source: www.stockcharts.com
Gold broke out of a small triangle on Friday putting in a strong up day and closing over the 50-day MA. Despite the breakout, we can’t say with complete confidence that the recent corrective period is over. The daily, weekly, and monthly trends have all turned up so that is a big positive. In that respect, we have what appears to be a good buy signal. However, there is more work to be done. Of greater importance gold needs to successfully clear the $1,300 to $1,320 zone. Once that happens there appears to be little in the way of resistance for a rise back towards the September 2017 high of $1,362 and the July 2016 high of $1,377. On the positive side, gold appears to be in a strong bull channel. Since the low of December 2016 at $1,124, gold has successfully made higher highs and higher lows. That is despite the evident wobbling from April to July 2017. We have seen a number of key cycle lows being made in the November/December period over the past few years before gold has embarked on what has been its strongest move of the year from roughly December to February/April. Given we firmly believe that gold prices are headed higher to $1,400 and even $1,500 the next up move could well be a strong one.
Naturally, there are some niggling concerns. First, as we will note next, the commercial COT is not improving. Second, despite silver also breaking upwards on Friday, silver has lagged and is up only 8.6% in 2017 vs. gold’s gain of 12.6% thus far this year. Third, the gold stocks that are usually the leaders have been downright miserable. The Gold Bugs Index (HUI) is up 3.1% in 2017 while the TSX Gold Index (TGD) is up a small 0.7% after spending considerable time in negative territory. But one positive area has been the performance of palladium and copper. Palladium is up 45.3% so far in 2017 while copper is up 22.5%. While neither metal is thought of as being a precious metal, both exhibit characteristics of precious metals. Copper has been historically used in coins so copper, like gold and silver, has monetary value.
Gold appears to have considerable support in the $1,260 to $1,270 zone, so as long as that holds gold should eventually take out the key resistance above.

Source: www.cotpricecharts.com
Last week’s COT was released on Monday while this week’s COT came out on Friday as per usual. The COT release this week can only be termed a disappointment. The commercial COT remains stuck at 27%, a level where we have been for the past 7 or 8 weeks. This past week there was little in the way of movement at all for both long and short open interest. The large speculators COT also remains stuck at 78%. We would like to see a commercial COT up around 40% to be absolutely convinced that a low is most likely in. However, it is fair to point out that the commercial COT stayed relatively negative all throughout the huge rally to $1,924 in 2011. The silver commercial COT also remains stuck at 28% again with little in the way of movement. So there is little in the way of clues here.
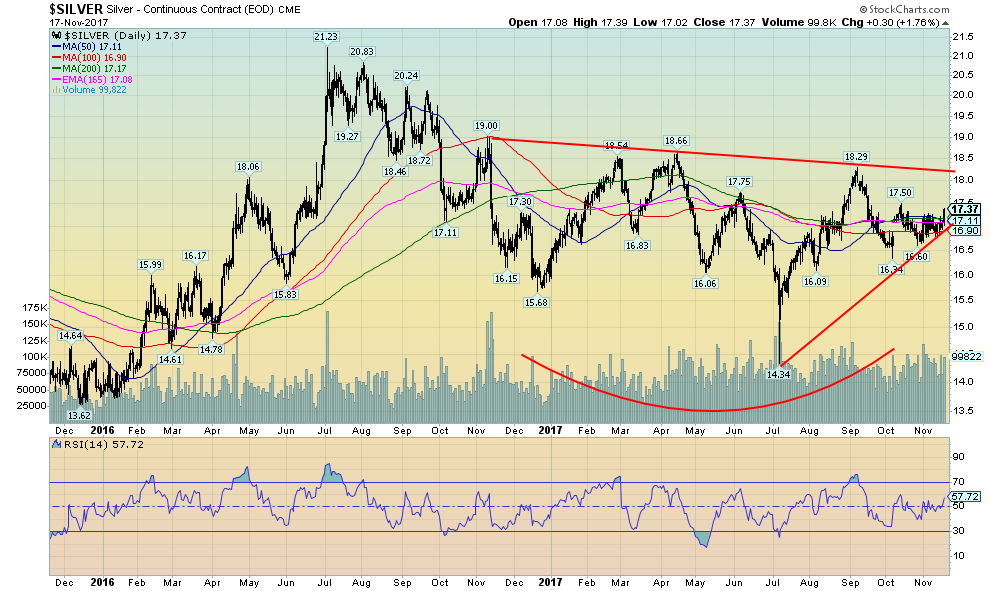
Source: www.stockcharts.com
Silver, like gold, jumped out of a small triangle pattern on Friday and closed over the key MAs. Despite the jump in price silver has not been as bullish looking as gold. We have noted before that the July 2017 low was well below previous lows. Gold did not make a similar move. As well, while gold fell just short of its July 2016 high silver was nowhere near that high of $21.23. Silver couldn’t even take out its April 2017 high of $18.66. Gold easily surpassed that level. In a true bull, silver prices lead. Silver prices also lead in bear markets as well. So the failure of silver to make any real impression leaves us scratching our heads and wondering whether the recent down move is really over. $17 should now act as support and there appears to be strong support down to $16.60/$16.70. Below that level, it is probable that silver would move below $16.34 the September 2017 low. Our only firm conviction is that silver, like gold, remains in the throes of a significant up move and once the evidence is in that a low has been made the next move to the upside should be a strong one. Silver needs to break out over $18/$18.20 to convince us that the next up move is underway. Until that happens, there remains some downside risk despite Friday’s up move.
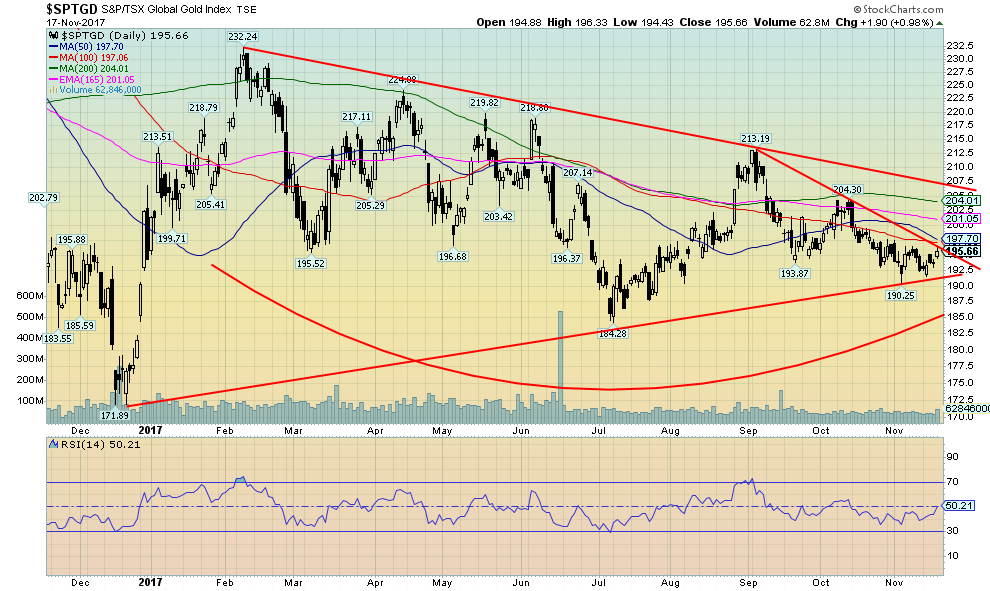
Source: www.stockcharts.com
Gold stocks remain miserable. While gold and silver were both enjoying good up days on Friday the gold stocks could only see gains of roughly 1%. Sounds good, no? Wel,l actually not. A strong $15 up day as we saw Friday for gold should have seen the TSX Gold Index (TGD) put in gains of at least 3%/4%. The TGD didn’t even break its downtrend line on Friday. Sentiment towards the gold stocks remains poor. We are not impressed with what appears to be a downward sloping channel. That’s negative considering gold’s channel is pointed upward and silver is making what appears to be a nice rounded bottom pattern. The gold stocks as represented here by the TGD look like they could fall off a cliff. The July low was below previous lows although it held above the December 2016 low but not by a lot. There is strong resistance up to 205/210. But a breakout over 210 would be quite positive. Support appears to be forming in the 190 range but below that, a run down to 180/185 is likely.
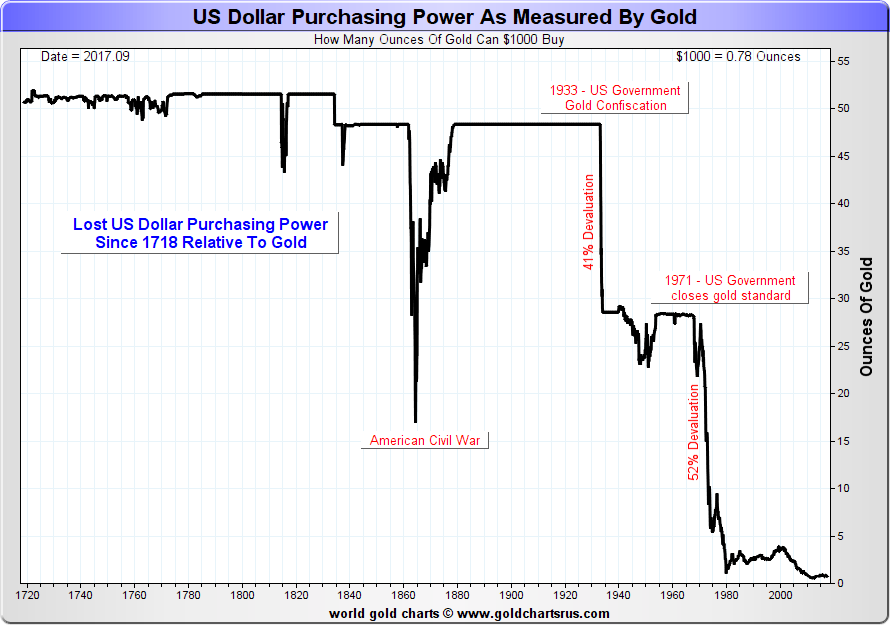
Source: www.goldchartsrus.com
We are always amazed by how much the purchasing power of the dollar has fallen. The above chart refers to the US$ but it could be applied to any major currency including the Euro, the Cdn$, the Pound, the Japanese Yen, and the Swiss Franc. Quite simply your dollar is not worth what it used to be. Today US$1,000 only buys you 0.78 ounces of gold. Back in the late 1700s and up until about 1840 $1,000 bought you over 50 ounces of gold. Grant you, it was a lot harder to earn $1,000 back then. Most people’s annual income didn’t come anywhere close to $1,000. So while we earn more our dollars do not stretch as far as they used to. Even back in August 1971 when former President Richard Nixon closed the gold window (a U.S. default of monumental proportions) $1,000 bought you around 28.5 ounces of gold. Using the same analogy on the Dow Jones Industrials (DJI) back in August 1971, $1,000 bought you 0.96 units of the DJI. Today that same $1,000 would only buy you 0.04 units. The Dollar is not what it used to be.

Source: www.stockcharts.com
We should not take lightly the current maneuverings in the Mid-East. While last week Saudi Arabia backed off somewhat on its threats against Lebanon (really aimed at Hezbollah) and that sparked a drop in WTI oil prices the crisis and the threats are not over. Saudi Arabia and Israel want Iran out of Syria. Except Iran is going nowhere and they are there at the invitation of Syrian President Bashar Assad. As well, the Russians remain entrenched in Syria and are also going nowhere. Russia has an important naval base on the Syrian coast and they are not about to relinquish that hold. The question is, are Saudi Arabia and Israel prepared to go to war to oust Hezbollah and the Iranians. Any war would drag in the U.S. and by extension the Russians (and even the Chinese who also have an important presence in Syria). As well, the Iraqi government, while ostensibly aligned with the U.S., is actually more aligned with Iran. One needs a program to distinguish friend or foe. Depends on which side you are on. An outbreak of war in the region could trigger WW3 with nuclear powers. If all of this burst on to the scene some have said oil prices to go to $300/barrel and that would crash the global economy. The Saudi oil fields are vulnerable and as are the Straits of Hormuz, where the Iranians would be poised to sink ships to block the exit. Naturally, that would see a response from the U.S. who is committed to keep the Straits open. The recent low was at $54.81 so if that is breeched WTI oil could fall back to next support at around $53. The recent high was seen at $57.92 and the trend is higher. WTI oil is more likely to break above $58 then fall below $53 right now. Currently, targets appear to be up around $80.
Disclosure: None.


