
Tech And Real Estate Remain The Red-Hot Equity Sector Leaders
If you’re wondering why certain US equity strategies are outperforming this year, there’s a decent chance that overweighting technology and real estate sectors has been the secret sauce for success. Similarly, relatively weak results are probably linked to decisions to underweight these slices of the US equity market.
Indeed, shares of tech and property shares continue to lead among the major US equity sectors year to date—by wide margins, based on performances via a set of exchange trading funds. Despite a rocky ride in stocks generally in 2019, the elevated volatility has yet to shake tech and real estate from their respective first- and second-place perches.
Technology Select Sector SPDR (XLK) has surged 28.4% so far this year through yesterday’s close (Aug. 20). Real estate investment trusts (REITs) are a close second-place leader via Real Estate Select Sector SPDR (XLRE), which is sitting on a 26.6% year-to-date total return.

Another feature in this year’s sector performances is the increasingly wide dispersion of results. Contrasting tech’s glittering run in 2019 is the dowdy advance in energy shares, which are up a trifling 2.5% so far this year, based on Energy Select Sector SPDR (XLE). Not only does that pale next to the sector leaders, energy’s weak gain looks frumpy next to the broad stock market’s 17.2% rally this year, based on the SPDR S&P 500 (SPY).
Tech is on top, but investors are pondering the implications of government proposals to investigate the sector’s leading names. On Monday, several states announced plans to move ahead with an antitrust investigation of big tech. The news followed last month’s decision by the Justice Department to scrutinize the major tech companies for possible anti-competitive behavior.
Despite the potentially bearish threat hanging over the sector, tech stocks showed minimal signs of stress in recent sessions. For the moment, XLK is holding near August highs.

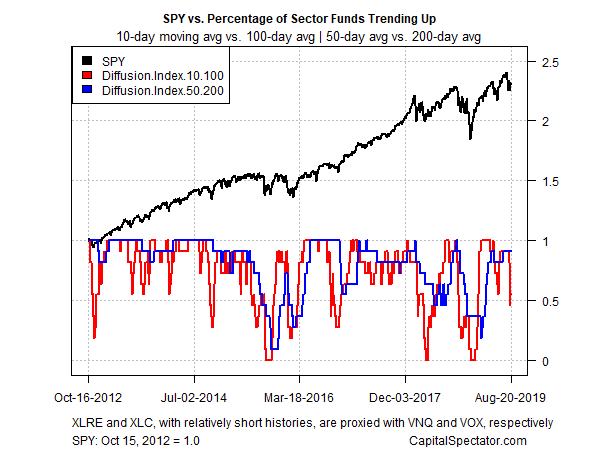
Note, however, that a momentum profile of US equity sectors is showing signs of a new weakness. The analysis is based on two sets of moving averages for the ETFs listed above. The first compares the 10-day moving average with its 100-day counterpart — a proxy for short-term trending behavior (red line in the chart below). A second set of moving averages (50 and 200 days) represents an intermediate measure of the trend (blue line). In recent sessions, the short-term trending indicator has fallen sharply and is now close to the lowest print so far this year. It’s unclear if this is noise or an early warning of stronger headwinds for equities generally. But after a stellar run in stocks generally this year, the stumble in short-term momentum for several sectors may be a warning that rougher waters await for the remainder of 2019.
Disclosure: None.


