
Stocks Trying To Break Out Relative To Bonds
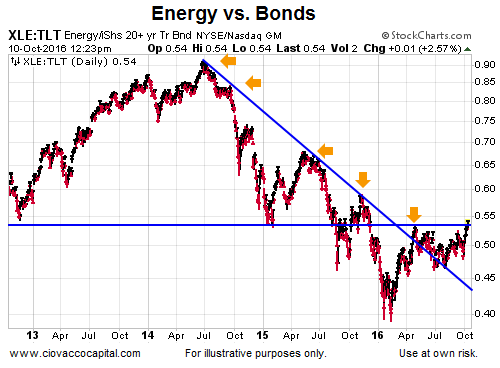
Energy Stocks Above Prior Resistance
When investors are more confident about economic and market outcomes, they typically prefer to own growth-oriented sectors, such as energy, over more defensive-oriented bonds. The chart of energy stocks (XLE) relative to long-term Treasury bonds (TLT) is trying to hold above an important point of prior resistance. The longer XLE can hold the breakout relative to TLT, the more meaningful it becomes.
(Click on image to enlarge)
Deterioration In Numerous Asset Classes
Many interest rate sensitive assets, including gold, bonds, and REITS, sold off last week. This week’s video looks at the deterioration in the context of risk management. Updated longer-term charts are also covered for the S&P 500 and broad NYSE Composite Index.
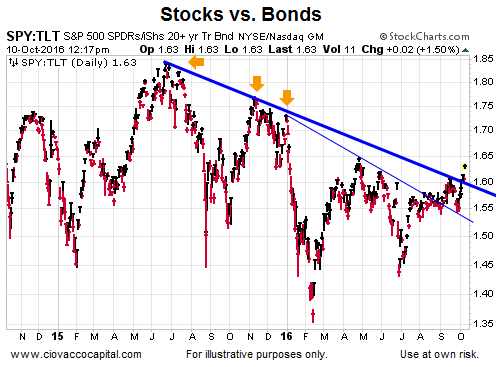
Stocks vs. Bonds
The chart of stocks (SPY) relative to bonds (TLT) is sending similar messages to those seen in the energy/bonds ratio. The SPY/TLT ratio was rejected at the thick blue trendline three times in 2015 (see orange arrows) and again in September 2016. The longer SPY can hold the breakout relative to TLT, the more meaningful it becomes.
(Click on image to enlarge)
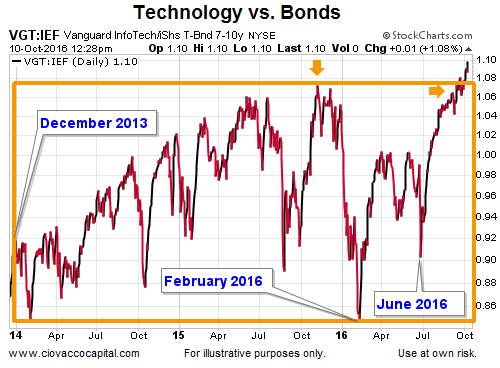
Tech Trying To Clear A Long-Term Box
The chart below shows the performance of technology stocks relative to intermediate Treasury bonds (IEF). The ratio entered the long-term orange consolidation box in December 2013 (almost three years ago). The ratio was near the lower end of the box as recently as June 2016. The breakout sends signals about the economy and interest rate expectations.
(Click on image to enlarge)
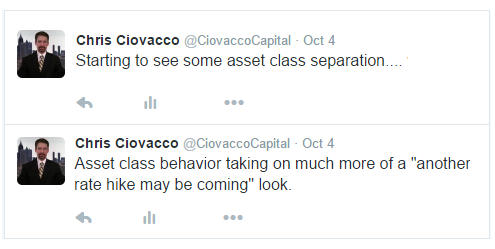
Rate Hike Odds
On October 4 following some strong economic data, asset class behavior started to signal two things: (1) the odds for a Fed rate hike in December were increasing, and (2) the economy and markets might be able to withstand the hike this time. Obviously, with quite a bit of time between now and the Fed’s December meeting, 1 and 2 above fall into the TBD category.
Similar Messages From High Beta
The High Beta ETF (SPHB) has higher weightings in materials (XLB), energy (XLE), and financials (XLF) relative to the S&P 500’s weightings (SPY). As shown in the chart below, this economically-sensitive investment is trying to hold the recent break above an area that has acted as resistance for a year. As recently as June 28 (point A below), SPHB looked to be on the ropes. Since then, SPHB has made a higher low (point B) and a higher high above point C.
(Click on image to enlarge)
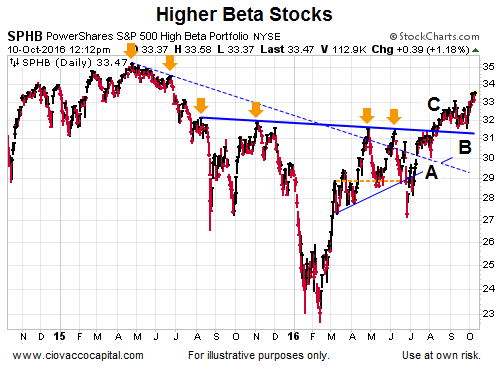
The longer SPHB can hold above point C, the more meaningful it becomes.
Disclosure: This post contains the current opinions of the author but not necessarily those of Ciovacco Capital Management. The opinions are subject to change ...
more


thank for sharing