Stocks Have Stalled And Cycles Point Down
Since it’s Monday, let’s get right to our weekly review of the state of the market and our major market indicators/models.
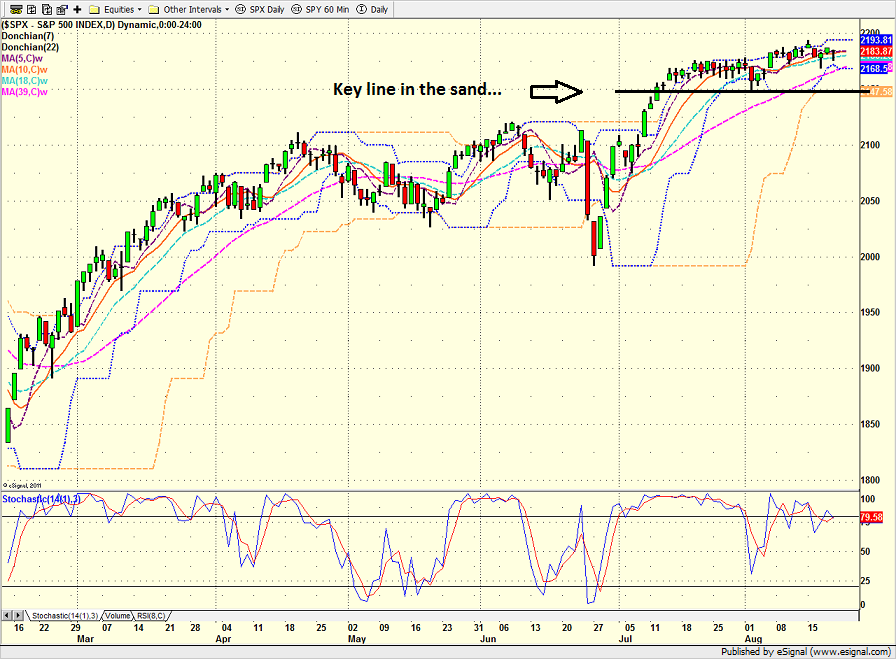
As usual, the first stop is a review of the price/trend of the market. Here’s my current take on the state of the technical picture…
- Stocks appear to have moved into stall mode
- S&P has made no price progress in the last 10 sessions
- However, so far at least, sideways is the new down
- S&P closed on the 5- and 10-day moving averages Friday
- The 5- and 10-day moving averages are now flat
- Short-term Donchian channel has tightened considerably
- The lower bound of the s.t. Donchian channel currently sits at 2172 – just 0.7% from current levels
- A meaningful break below 2147 would be a game changer
S&P 500 – Daily
(Click on image to enlarge)
From a longer-term perspective (e.g. looking at a weekly chart of the S&P 500)…
- Weekly chart of the S&P still looks good
- Bulls have a fair amount of room to work with on the weekly chart
- 2125 is key level from an intermediate-term perspective
S&P 500 – Weekly
(Click on image to enlarge)

Next, let’s look at the “state of the trend” from our indicator panel. These indicators are designed to give us a feel for the overall health of the current short- and intermediate-term trend models.
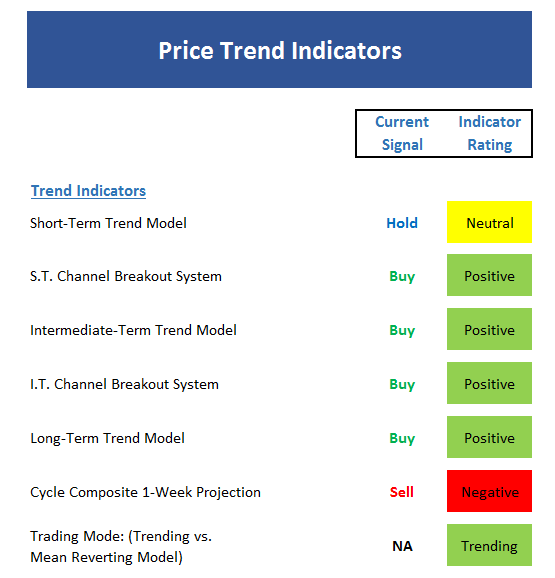
- Short-term trend model moved into neutral zone this week
- Channel Breakout systems both remain positive
- The Cycle Composite is negative for this week, neutral for the next, and negative again the next
- Thus, the seasonal cycle now becomes a headwind for stocks
- Two of our three Trading Mode models call this a “trending environment”
- This board supports a moderately positive stance
Now we turn to the momentum indicators…
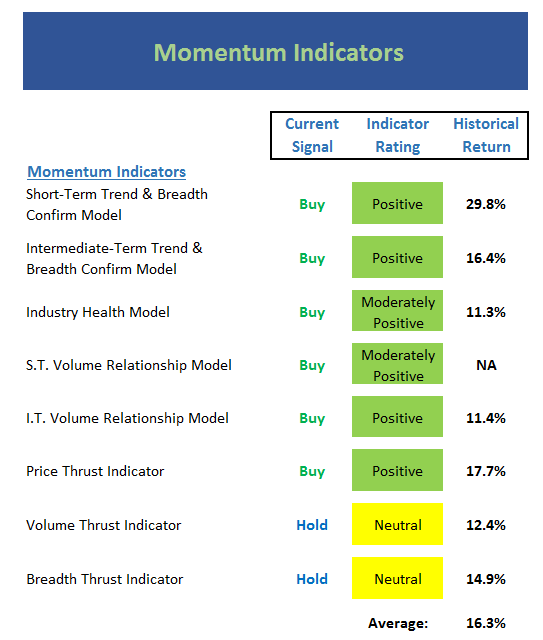
- Short-term Trend & Breadth Confirm model is positive – but has been flip-flopping almost on a daily basis
- Intermediate-term Trend & Breadth Confirm model remains positive
- Industry Health model still just moderately positive – a nagging concern in my book
- Short-term Volume Relationship model downgraded to moderately positive
- Volume and Breadth Thrust indicators confirm loss of momentum – but not bull killers
Next up is the “early warning” board, which is designed to indicate when traders may start to “go the other way” for a trade.
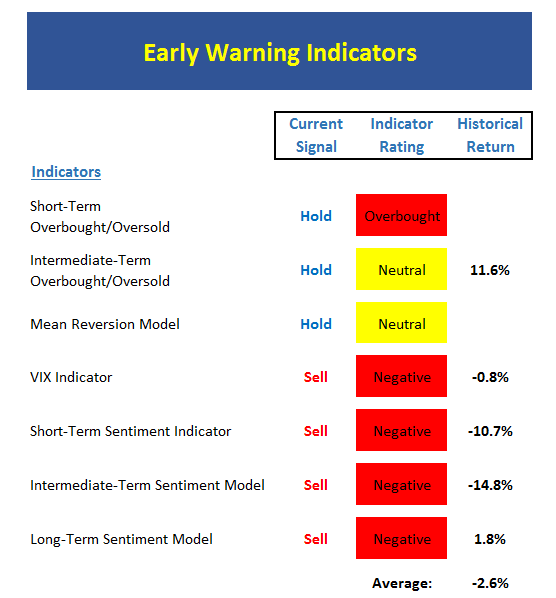
- This board remains a warning flag
- Short-term still overbought, but so far at least, this remains a “good overbought” condition
- Intermediate-term overbought condition has been worked off
- VIX remains at very low levels and worrisome (sign of complacency)
- Weekly VIX closed Friday at lowest level in nearly 2 years
- Sentiment models all waving yellow flags
- One of our long-term sentiment models (not shown on this board) is very close to a sell, which would be the first signal since mid-2013.
Now let’s move on to the market’s “external factors” – the indicators designed to tell us the state of the big-picture market drivers including monetary conditions, the economy, inflation, and valuations.
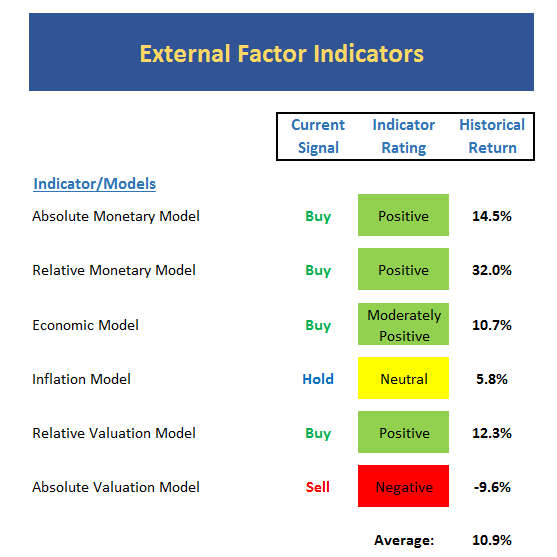
- Monetary conditions still in good shape. However, FOMC members trying to convince markets that rates will be going up (Fisher said Sunday that jobs and inflation near Fed’s targets)
- One of the components within the Economic model upticked last week in response to LEI
- Inflation model upticked modestly – still neutral – but argues that it is time for Fed to move on rates
- One of the components within the Inflation model upticked into the “moderate inflation expectations” mode last week – but only by a smidge. Key is to recognize that inflation expectations are rising a bit.
- On the Valuation front, the Median P/E indicator continues to move up – now at highest level ever seen save the tech bubble period from 1998-2000
- But… relative to interest rates and an improving economy, valuations still not a problem
Finally, let’s turn to our favorite big-picture market models, which are designed to tell us which team is in control of the prevailing major trend.
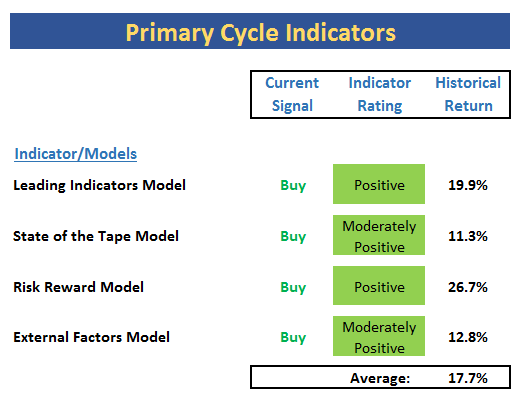
- Nothing new to report on this board
- External Factors model remains moderately positive with a reading of 71% – but a long way from the 100% reading seen earlier in year
- Leading Indicators model still positive at 90%
- Historical average return still well above norm
- The green on this board says it all – give the bulls the benefit of doubt
The Takeaway…
The current focus is on the Fed and the dollar. The worry is that the economy isn’t strong enough to handle multiple rate hikes going into 2017. So, with the Fed’s Jackson Hole Symposium happening this week (Yellen speaks on Friday) traders are likely to hang on every word. From an objective, modeling perspective, here’s my take: The trend is up. Market momentum has stalled. Stocks remain overbought. The sentiment models show complacency. The seasonal factors become a headwind until early October. The external factors are positive. And my favorite “big picture models” are all green. So, this would seem to suggest that (a) a pullback is likely in the near-term, (b) the action could be sloppy for a while, and (c) the “dip” should be bought. Any questions?
Current Market Drivers
We strive to identify the driving forces behind the market action on a daily basis. The thinking is that if we can both identify and understand why stocks are doing what they are doing on a short-term basis; we are not likely to be surprised/blind-sided by a big move. Listed below are what we believe to be the driving forces of the current market (Listed in order of importance).
1. The State of Global Central Bank Policies
2. The State of U.S. Economic Growth
3. The State of Oil Prices
Thought For The Day:
“The democracy will cease to exist when you take away from those who are willing to work and give to those who would not.” –Thomas Jefferson


you are right