
Stocks Don't Mind Gridlock Or Shutdowns

Image Source: Pixabay
Confusion Rewards Bulls, Not Bears
We now head into the fourth quarter of what has been a year marked by historical uncertainty. The chart below shows one measure of it based on a survey of small businesses. There isn’t any sign that the pace of potentially confusing news flow will slow down.
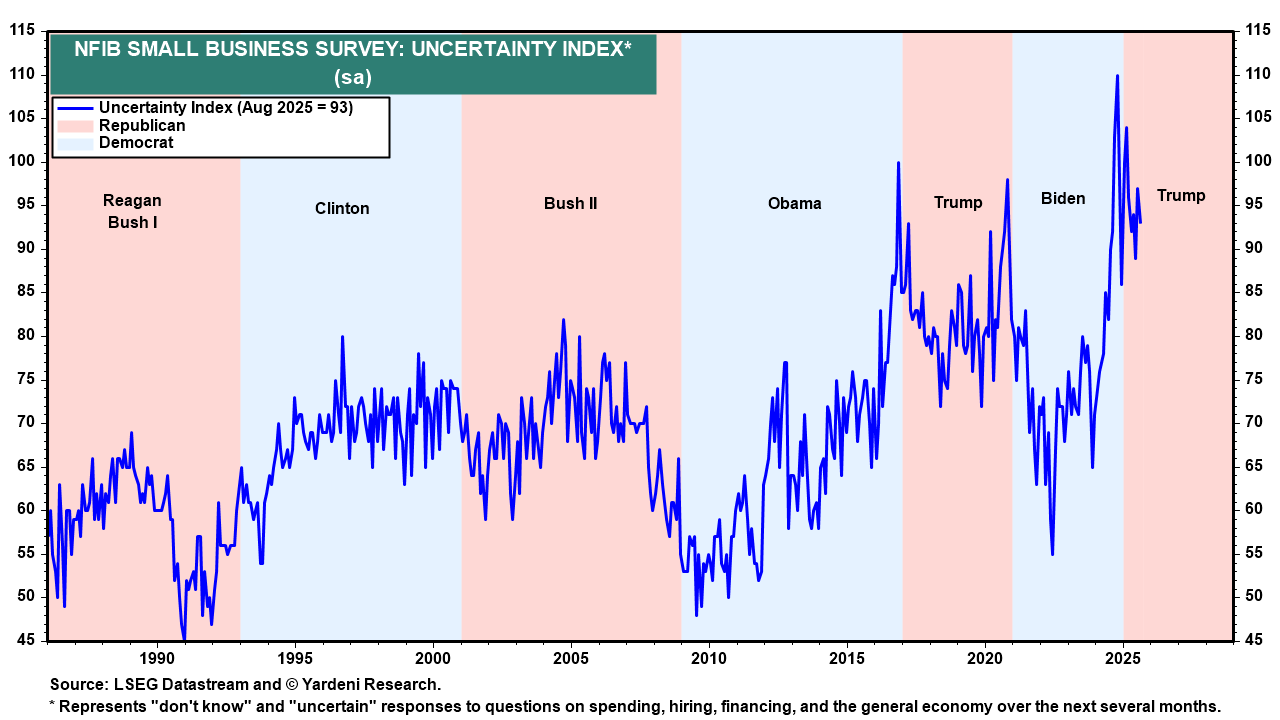
Hopefully, the trend of declining uncertainty that occurred during the beginning of the last Trump administration will repeat. This would indicate businesses adapting as they did until the pandemic created a new disruption.
However, given the record levels of uncertainty and the administration’s tactical preferences for leading initiatives with shock and volatility, the uncertainty level is unlikely to decline to “normal” levels.
Fortunately, markets have adapted. The bulls have become more resilient to extravagant news. Unfortunately for the bears, they seem to find the environment of elevated uncertainty ripe with opportunity, which keeps ending in disappointment.
As we’ve described in many ways here in the past, bull markets can be complicated if you:
- Focus on the news rather than the market’s reaction it
- Give too much credit to leading indicators that may lead, but aren’t very good at timing.
- Neglect to give markets enough credit for adapting and overcoming conditions that were once bearish but are now less so. For example, new tariff announcements.
Keeping market analysis simple means sticking to basic analysis of the first principle trends that drive bull markets, and having confidence in your risk management strategies. This will keep you on the right side of the biggest trends (whether they are up or down).
There Will Be Plenty of Bearish Noise
New tariff announcements are not going to stop. Two weeks ago, additional tariffs of 100% were announced targeting certain pharmaceutical imports, 25% tariffs on heavy-duty trucks, and 50% on bathroom vanities, and more.
Last week, news of a deal between Pfizer and the government on drug pricing and tariff relief sent healthcare stocks soaring.
The government shutdown is a big distraction, but not a bearish market concern. The news flow will be ugly around the shutdown, but as you can see from the table below, a shutdown is not a problem for stocks, at least not in the short run.
Be Careful Reading the Table Below
The table below is a small sample of government shutdowns. As you can see, Trump holds the record for the longest government shutdown. It lasted 35 days, starting on Dec. 22, 2018.
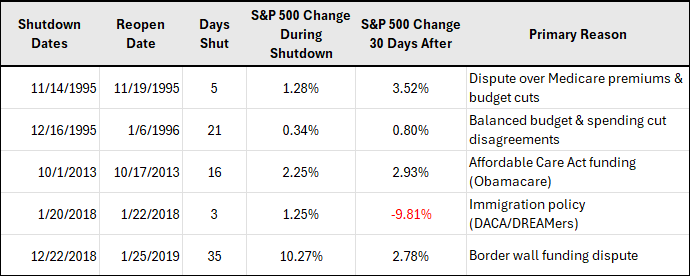
While the table suggests that the market was not impacted, and was in fact bullish during the 2018 shutdown, it’s important to remember the context.
At that time, the market had been selling off substantially, and on 12/24, the Fed reversed its monetary policy and began cutting rates. This is what sparked the market rally – not the shutdown. Nonetheless, the shutdown didn’t prevent the market from responding with the bullish move one would expect.
This week, I’ll limit this commentary to the following two charts that relate to how September foreshadows October and the month's seasonal trends.
September Was a Big Disappointment (For the Bears)
The news flow leading into September was a constant message that the recent seasonal bearish pattern for the month would repeat.
Not only did the markets rally, but they also created an opposite situation in which September's performance now foreshadows a bullish October and Q4, according to the work of Ryan Detric at the Carson Group, as shown below.
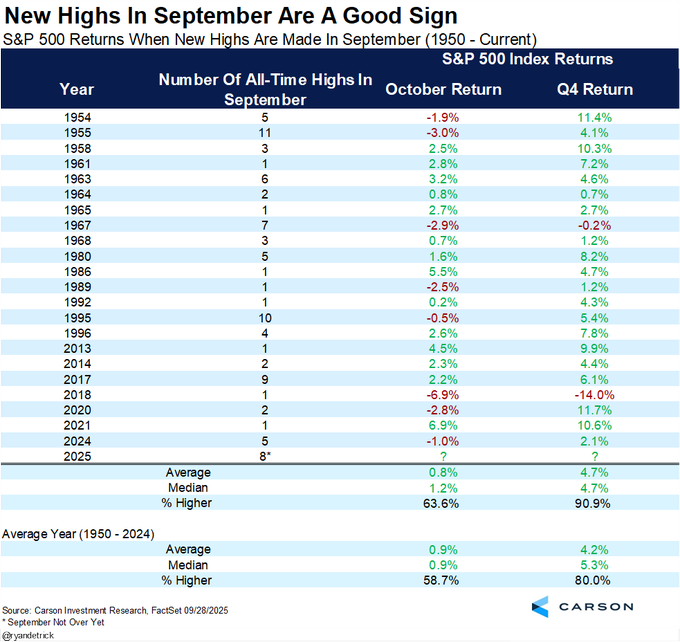
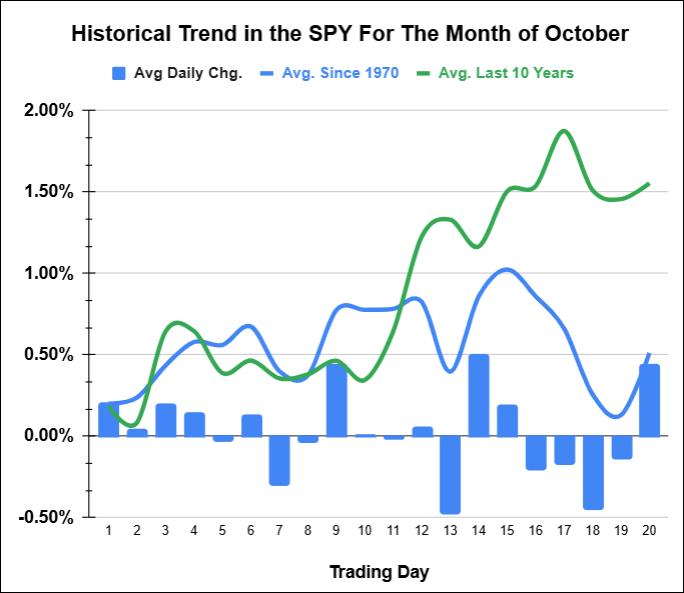
In summary, when September posts new all-time highs, it is often a good sign for the rest of the year. Furthermore, as shown in the chart below, October has been historically bullish, especially over the last 10 years.
How Will You Know If This Time is Different?
I was concerned about the bearish seasonal pattern of September as we approached it. However, we have some simple and effective trading tactics to keep our emotions in check and our trading in the direction of the actual trend (as opposed to the trend we think is going to happen).
One such tactic is to use the first trading day of the month as an “opening range” and trade it accordingly. This worked perfectly and easily in keeping us bullish through September. I’d use the same tactic again in October.
Now, I'll hand things over to Keith.
Every week, we review the big picture of the market's technical condition as seen through the lens of our data charts. The bullets below provide a quick summary organized by conditions we see as being risk-on, risk-off, or neutral.
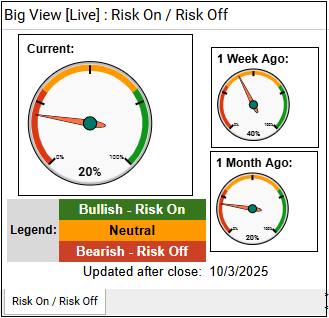
Summary
Markets surged to fresh all-time highs across the major indexes, with strong sector leadership from healthcare and semiconductors, improved internals, and both domestic and international equities holding onto firm bull phases. Gold’s strength has remained a rare counter-signal, along with weak risk gauges.
Risk-On
- Markets put in another strong week, hitting new all-time highs across the 4 major indexes, and markets seemed to show little regard for the government shutdown.
- Volume patterns strengthened this week, with more accumulation than distribution days seen in all the indexes except the Nasdaq, which was on the weaker side.
- Many of the major sectors remained in bull phases across the board, and IBB and SMH surged to new highs.
- Market internals bounced off their more neutral readings last week, with nice upticks seen in the up/down volume ratio and the McClellan Oscillator.
- The new high/new low ratio went from all negative readings last week to positive slopes across all time frames.
- Sector performance was quite strong, with healthcare up +7.22% and semiconductors up +4.62%. Energy was the only sector down, at -3.09%.
- Sentiment readings have remained low, though they did tick up a bit from last week's bottom, and both the 50- and 200-day moving averages have started to slope positive.
- Value and growth stocks have remained in bullish phases and hit new intra-week highs this past trading period.
- Both emerging and developed markets appear to be in bull phases and, critically, as we mentioned last week, developed markets held and bounced firmly off the 50-day moving average.
- Bitcoin surged and closed Friday near its highest close ever.
- Seasonally, October tends to be positive, though we have already matched the average October gain over the last ten years in just a few days.
Neutral
- The moving average of stocks above key moving averages witnessed a small improvement from last week’s reading, particularly for the Nasdaq, though the overall picture has remained fairly mixed.
Risk-Off
- The risk gauge weakened back to risk-off territory, though the change was primarily from the HYG/TLT ratio. The reading looks poised to flip back to risk-on.
- Gold continued to put in new all-time highs; a potential counter-signal to the extreme strength in equities.
For actionable trading ideas, please refer to the strategies discussed below.
Market Outlook
- The market is in a strong risk-on position, as shown by all four major indexes at new highs, broad sector and international participation, and improving internals.
- The only caution flags are gold’s strength (a hedge demand signal) and the temporary flip of the risk gauge to risk-off from HYG/TLT ratio, which looks likely to revert.
Trading Plan
- Equity Exposure (Core Positioning): Stay long equities across major indexes (SPY, QQQ, IWM, DIA). Add selectively on pullbacks to the 20-day moving averages.
- Stop-Loss: Exit or reduce positions if the S&P 500 closes below its 50-day moving average on rising volume.
- Sector Rotations: Overweight Healthcare (XLV, IBB) and Semiconductors (SMH, SOXX) given their outsized strength (+7% and +4%, respectively). Avoid or underweight Energy (XLE) until relative strength improves.
- Stop-Loss: Use 3%-5% trailing stops or close if sector ETFs break below recent breakout levels.
- Sector Rotation Confirmation: Continue to monitor the major sectors, as all appear to be in bull phases. Use weakness in leaders like retail (XRT) or transportation (IYT) as an early warning for a potential rotation.
- International Markets: Increase exposure to developed markets (EFA), as they confirmed support at their 50-day moving average. Add a tactical position in emerging markets (EEM) while momentum holds.
- Stop-Loss: Close if EFA or EEM break below the 50-day average with volume expansion.
- Bitcoin: Consider a position in BTC or BITO, as Bitcoin has been pressing near all-time highs.
- Risk Management/Hedges: Maintain a small allocation to gold (GLD) as a hedge against a potential equity reversal.
Actionable Summary
- Stay long equities, overweight healthcare and semis, underweight energy.
- Add developed/emerging markets and a tactical Bitcoin position.
- Hedge with a small gold allocation and use 50-day MAs as key downside stops.
More By This Author:
What You’re Not Hearing About September’s Bad ReputationHome Builders Vs. Semiconductors
A Feast Of Data, But No Free Lunch
Disclaimer: The information provided by us is for educational and informational purposes. This information is based on our trading experience and beliefs. The information on this website is not ...
more

