
Stocks Are Overvalued, Expect Losses And Low 10-Year Forward Returns: Update October 2025

Image Source: Pexels
- The S&P 500 averaged 6,736 for October 2025, 2,604 points above its long-term trend of 4,132, implying a 39% decline to reach the trend and signifying a valuation substantially above historic norm.
- The long-term trend indicates a forward 10-year annualized real return of only 1.4%, while the CAPE-MA35 methodology derived 10-year annualized real return is also modest at about 4.3%, indicating limited long-term upside.
- The short-term outlook indicated by CAPE-MA35 Neutral phase has historically yielded low short-term returns.
This report updates our ongoing series of market valuation analyses and forward return projections initiated in 2012. The previous update, issued in April 2024, indicated modest forward returns.
The projections presented here rely on our CAPE-MA35 methodology, described in the January 2019 article Estimating Forward 10-Year Stock Market Returns using the Shiller CAPE Ratio and its 35-Year Moving Average, and the CAPE-MA35 Market Timing Framework, which uses the 6-month moving average of the CAPE-MA35 ratio to identify market phases.
Forecasting Returns to 2035 using the Long-Term Trend
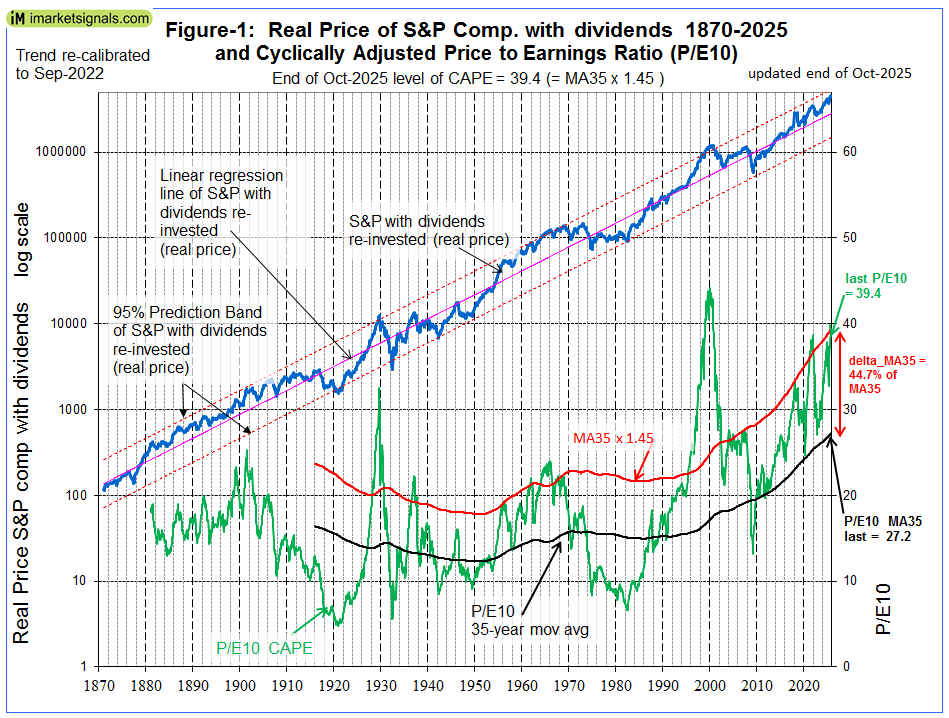
Historic data from the Shiller’s S&P series provides the input for estimating potential market outcomes. Figure-1 presents the S&P-real Index—the inflation-adjusted S&P Composite with dividends reinvested from 1871 onward, plotted on a semi-logarithmic scale—along with its best-fit trend line and corresponding 95% prediction bands, updated through October 2025. There is no indication that this long-term trend will be disrupted.
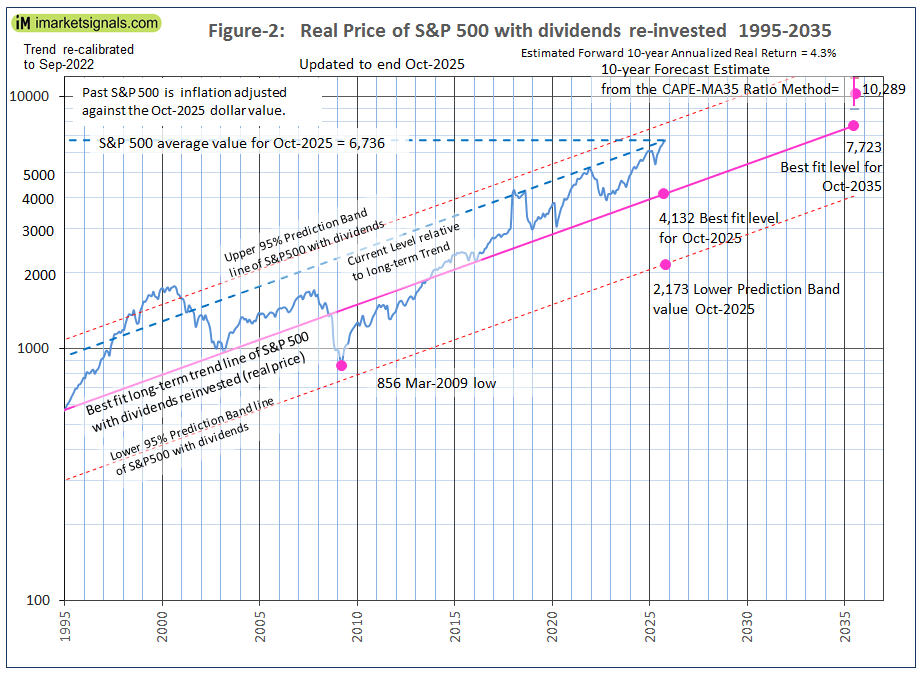
The S&P-real value at the end of October 2025 was 6,736, which was the average of the S&P 500 for October. Extending the best-fit trend line to October 2035 (Figure-2) yields a projected S&P-real value of 7,723, implying a probable 10-year total gain of approximately 15%, or an annualized real return of about 1.4%, reflecting a modest long-term outlook.
(Click on image to enlarge)
Forecasting Returns to 2035 using the CAPE-MA35 Ratio
Also shown in Figure-1 are the Shiller CAPE-ratio (which is the S&P-real divided by the average of the real earnings over the preceding 10 years) and its 35-year moving average (MA35), which at the end of October 2025 were 39.4 and 27.2, respectively—placing the CAPE 45% above its MA35.
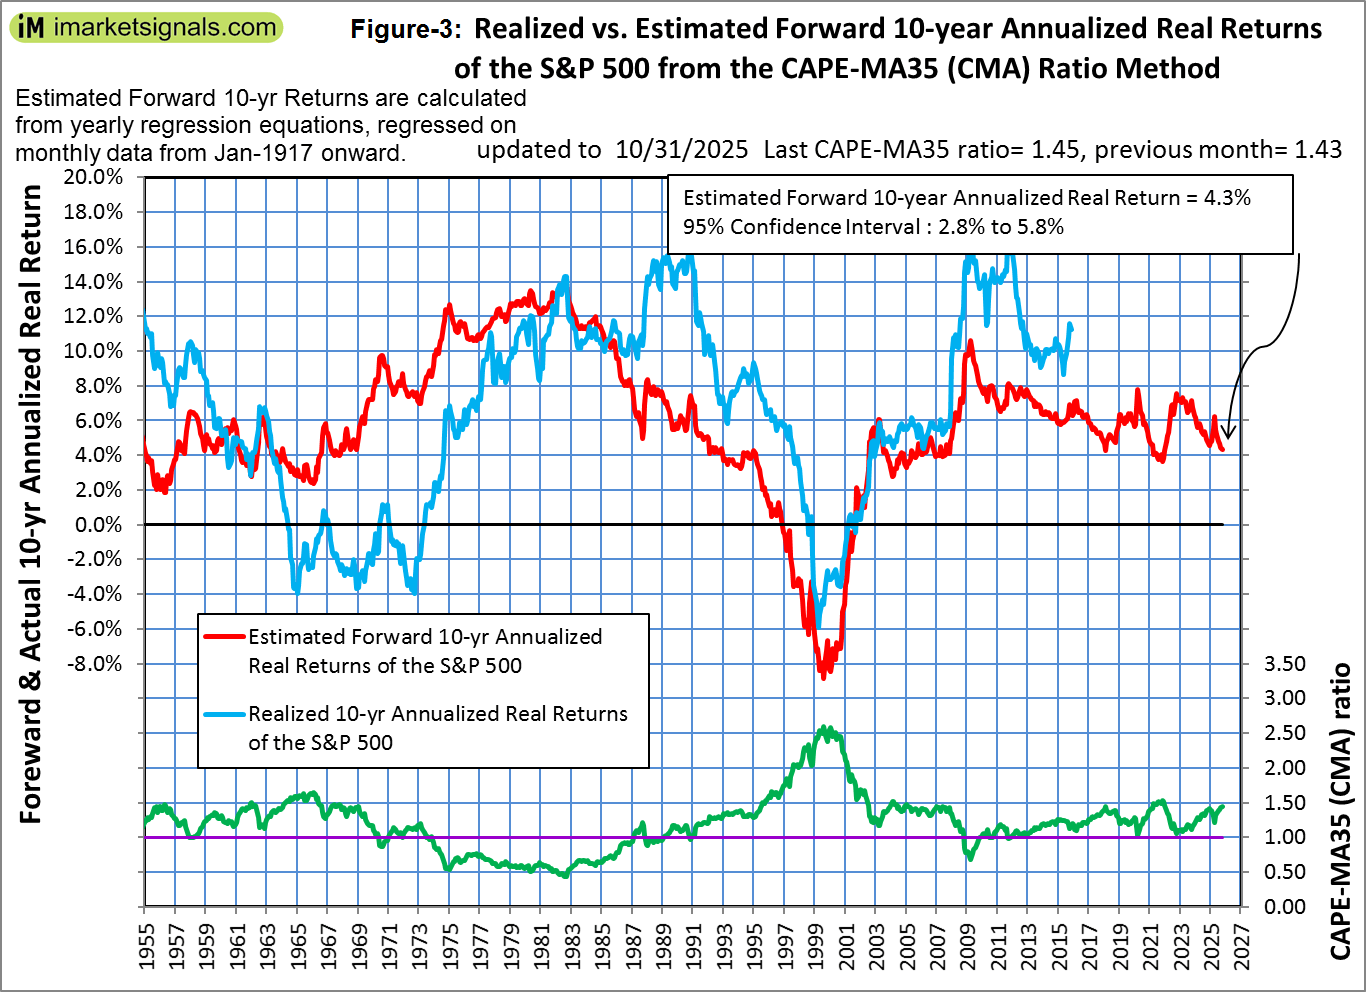
As detailed in the referenced article, the CAPE-MA35 ratio (CAPE ÷ MA35) provides a superior method for estimating 10-year real returns. The current ratio of 1.45 forecasts a probable 10-year annualized real return of approximately 4.3% (Figure-3), implying an end-of-October 2035 value of 10,289, with upper and lower confidence bounds of 11,800 and 8,900 (Figure-2).
(Click on image to enlarge)
Short-Term Stock Market Outlook from the CAPE-MA35 Market Timing Framework
The CAPE-MA35 ratio has risen from 1.30 in March 2025 to 1.45. Its six-month moving average, currently at 1.36, places the market in Phase 3.c (Neutral). Historically, since 1999, this phase has produced subdued short-term returns, averaging 3.5% over an average duration of nine months, as detailed in the table below. Accordingly, short-term performance is therefore expected to be low or even negative.
| Symbol | Open | Close | Pct Return |
| SPY | 11/4/2002 | 12/2/2002 | 3.10% |
| SPY | 12/1/2003 | 4/5/2004 | 7.10% |
| SPY | 10/4/2004 | 10/2/2006 | 16.50% |
| SPY | 1/3/2007 | 4/7/2008 | -3.00% |
| SPY | 3/5/2018 | 1/7/2019 | -6.30% |
| SPY | 2/1/2021 | 9/7/2021 | 20.30% |
| SPY | 6/6/2022 | 10/3/2022 | -11.50% |
In Figure-2 the S&P-real average level for October, 6,736, is 63% above the long-term trend value of 4,132, indicating a pronounced degree of overvaluation. Additionally, the S&P 500’s position relative to its long-term trend (illustrated by the line drawn parallel to the trend line) has risen to levels comparable to September 2018 and November 2021, periods that preceded notable market corrections of approximately 10% and 20%, respectively. Although historical parallels do not imply causation, the current alignment suggests an elevated risk of a correction. CAPE-MA35 ratios at those times — 1.39 and 1.53 — closely match the current 1.45, indicating that the market may again be overextended.
Conclusion
- Valuation: The S&P 500 is substantially overvalued relative to historical norm.
- Long-Term Outlook: 10-year forward annualized real returns are modest, ranging between 1.4% and 4.3%, suggesting limited upside.
- Short-Term Outlook: The CAPE-MA35 Neutral phase historically yields low or negative returns.
- Portfolio Implications: Defensive positioning may be prudent given the elevated risk of market declines.
Updates of the S&P-real estimated 10-year forward return and the current investment phase indicated by the CAPE-MA35 Market Timing Framework are periodically posted at iMarketSignals.
Appendix
The best fit line and prediction band (re-calibrated to Sep-2022)
The best fit line and prediction band were calculated from monthly data from Jan-1871 to Sep-2022.This includes now an additional 10 years of data of the SP-real values for the period after July-2012, previously not included in the regression analysis.
The equation of the best fit line is y = 10(ax+b)
y = is the dependent variable of the best fit line.
x = are the number of months from January 1871 onward.
a =0.002321819
b = 2.133179076
R2= 0.98
The parameters for the 95% prediction band lines are:
Upper: a = 0.002321819, b = 2.412217299
Lower: a = 0.002321819, b = 1.854140854
More By This Author:
Stocks Are Still Overvalued Despite Recent Significant Declines
Stocks Are Overvalued Expect Only Modest 10-Year Forward Returns: Update March 2025
Stocks Are Overvalued And 10-Year Forward Returns Look Poor: Update December 2024
Disclaimer: The information provided is based on mathematical models using public available economic data. The charts depict the results of our models and are not influenced by any other factors ...
more

