
Sterling Price Outlook: British Pound Rally Testing Key Resistance
The British Pound is virtually unchanged against the US Dollar since the start of February despite a monthly range of more than 2.6%. The recent recovery in price now takes Sterling back towards the monthly highs the focus on a key resistance barrier just higher. These are the updated targets and invalidation levels that matter on the GBP/USD charts heading into the close of the month.
GBP/USD DAILY PRICE CHART
(Click on image to enlarge)
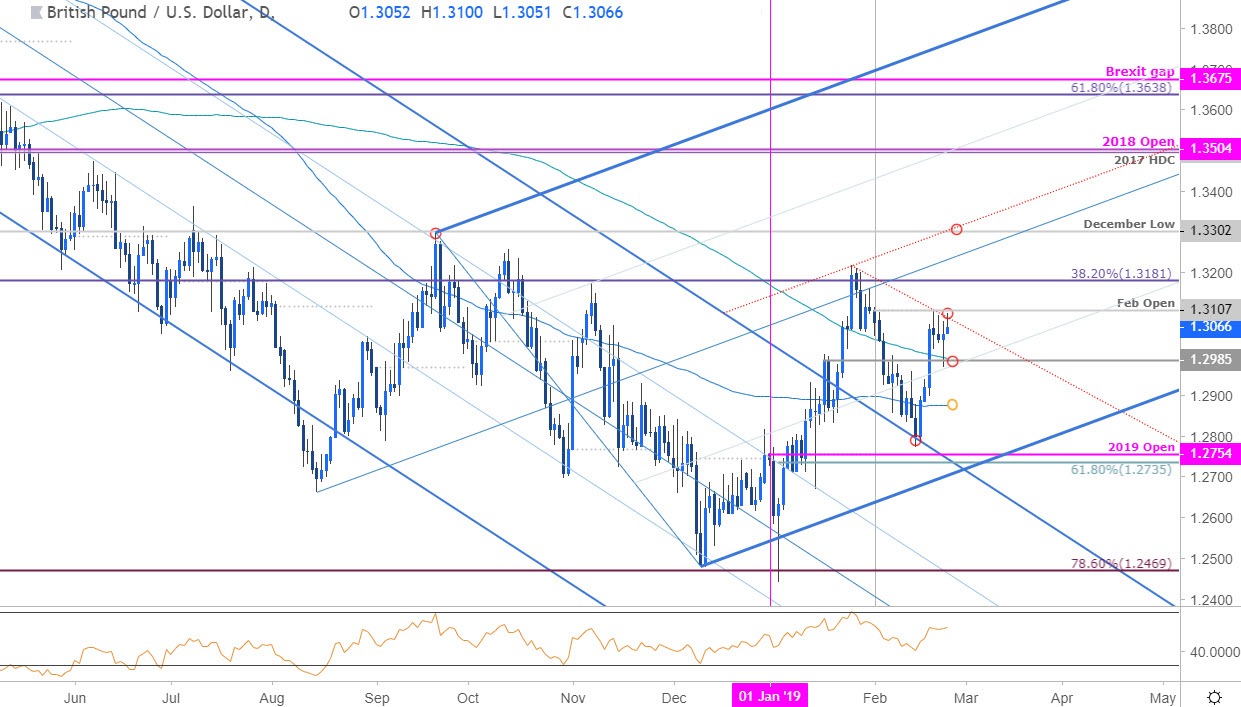
Technical Outlook: In my latest GBP/USD Weekly Technical Outlook we noted that a three-week decline had, “taken Sterling back towards yearly open support and leaves the immediate short-bias vulnerable while above 1.2738.” Price registered a low at 1.2773 that week before reversing higher with the advance now eyeing the February opening-range high / monthly-open resistance at 1.3107/15. A breach/close above this zone is needed to keep the recovery viable with near-term bullish invalidation now raised to 1.2985.
GBP/USD 120MIN PRICE CHART
(Click on image to enlarge)
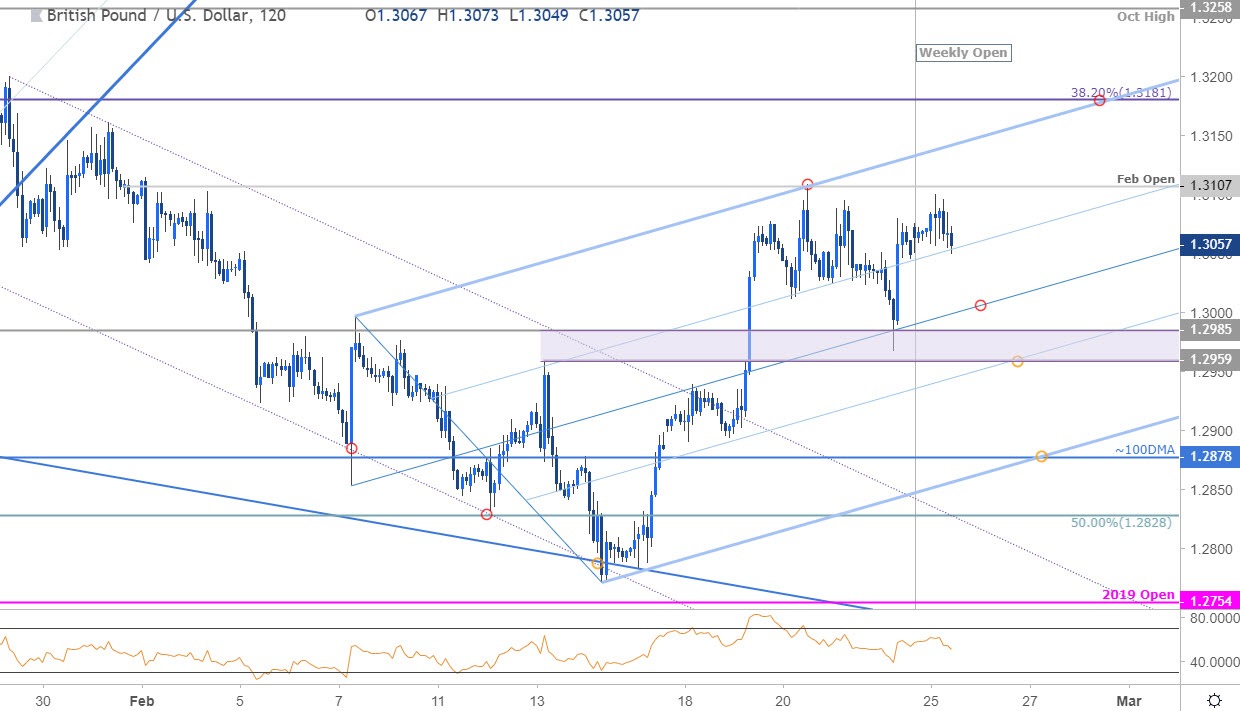
Notes: A closer look at price action shows Sterling trading within the confines of an ascending pitchfork formation extending off the monthly lows with price truing from confluence support on Friday at 1.2959/85– Weakness beyond this threshold would shift the focus lower with such a scenario targeting the lower parallel / 100-day moving average at ~1.2878. Initial resistance stands at 1.3107/15 with a topside breach exposing the upper parallel / 38.2% retracement at 1.3181- look for a bigger reaction there IF reached.
Bottom line: Sterling has come full-circle and is trading just below monthly-open resistance. IF price is heading higher, intra-day losses should be limited to 1.2960 with a topside breach above the February range-highs needed to mark the resumption of the mid-month recovery targeting 1.3181. From a trading standpoint, a good place to reduce long-exposure and raise protective stops - be on the lookout for exhaustion on a move towards the median line. A break below this formation would shift the focus back towards the yearly open at 1.2754.
GBP/USD TRADER SENTIMENT
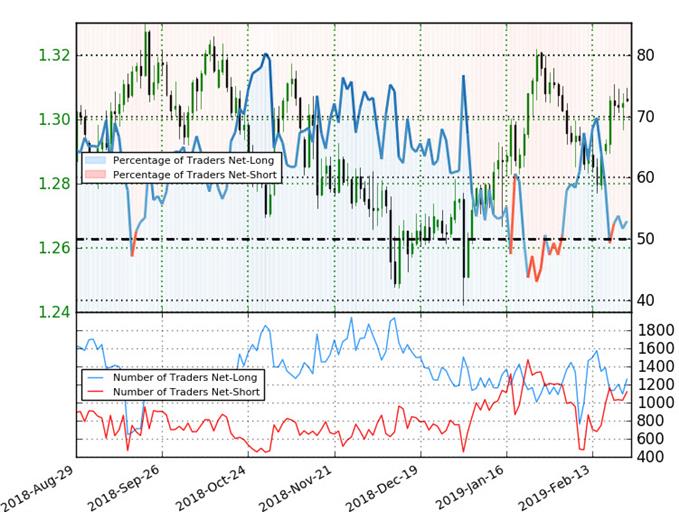
- A summary of IG Client Sentiment shows traders are net-long GBP/USD - the ratio stands at +1.12 (52.9% of traders are long) – weak bearish reading
- Long positions are 8.2% higher than yesterday and 14.2% lower from last week
- Short positions are 5.6% higher than yesterday and 19.7% higher from last week
- We typically take a contrarian view to crowd sentiment, and the fact traders are net-long suggests GBP/USD prices may continue to fall. Traders are more net-long than yesterday but less net-long from last week and the combination of current positioning and recent changes gives us a further mixed GBP/USD trading bias from a sentiment standpoint.


