
SPX: 100-Point Rally Ahead?
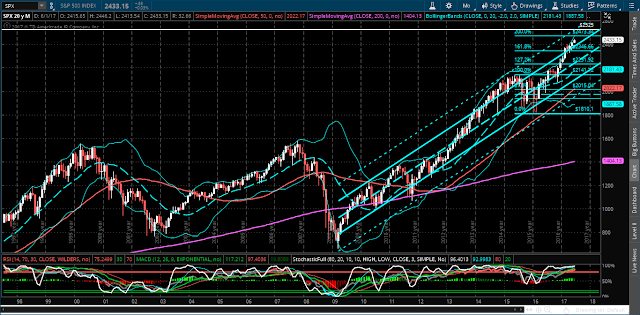
From the Monthly chart below of the S&P 500 Index (SPX), we could see it rally another 100 points, or so, to around 2525, before it stalls or a meaningful pullback occurs.
That price level would surpass a 200% external Fibonacci level at 2473.34 and intersect with a +1 standard deviation of a long-term regression channel from the 2009 lows.
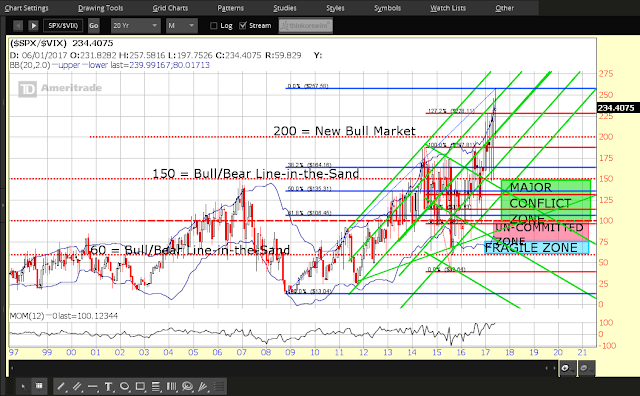
June's high-wave candle on the following Monthly ratio chart of SPX:VIX shows that volatility has been creeping in, as equity traders become more cautious on the upside.
However, the Momentum indicator is at an all-time high on this timeframe, signalling that bulls remain in charge, in spite of a slight rise in volatility. As such, this ratio chart is worth monitoring, if the SPX continues its rally to new highs. Depending on how June's candle closes, along with the level of the Momentum indicator at that time, we may be able to determine future strength or weakness of the SPX.
Stay tuned...
DISCLAIMER: All the information contained within my posts are my opinions only and none of it may be construed as financial or trading advice...
please read my full Disclaimer more


Thanks for sharing, looking forward to more by you.
Many thanks, Bill! :-)