
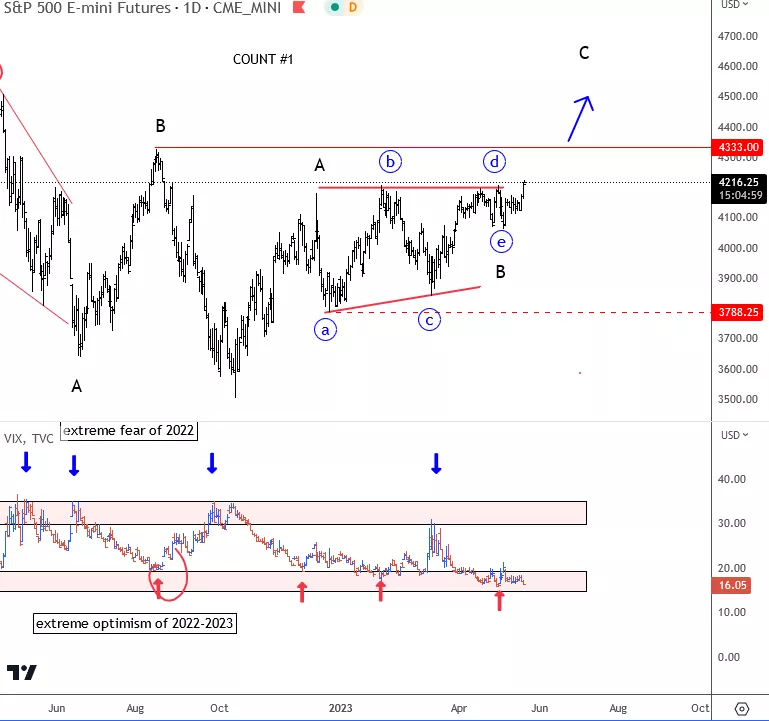
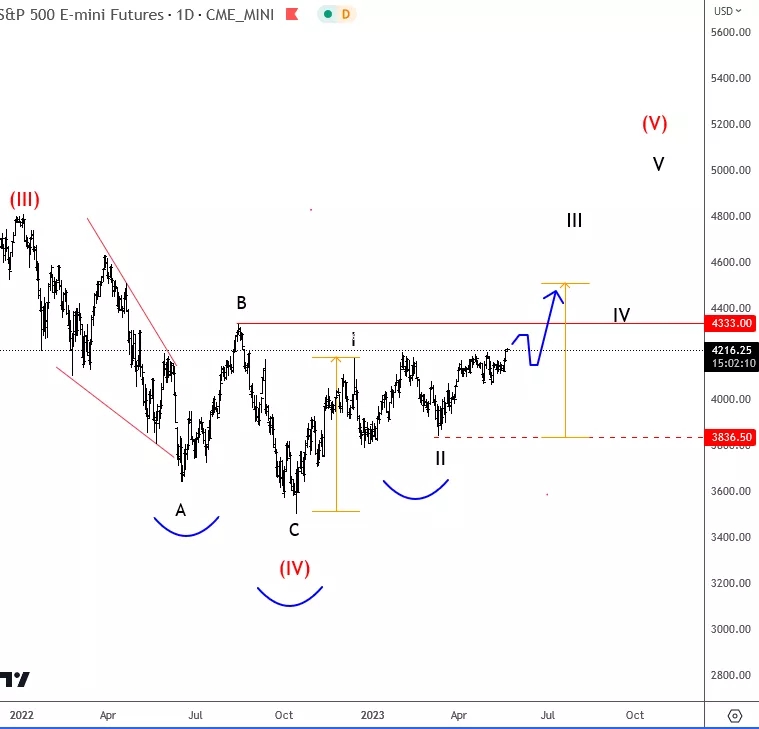
SP500 has been trading sideways for some time and it was ideally trapped in consolidation, which we see it as a bullish triangle. It’s a five-wave move between two contracting trendlines that can be completed now after recent push higher. If stays at highs, above 4200 level for a weekly close, then we are pretty sure that bulls are on track. We are tracking two daily counts at te moment, and both suggest there can be room for more upside, either for wave C regarding primary count or maybe even wave 3 of a five-wave bullish impulse according to secondary count.
SP500 Daily Count #1
(Click on image to enlarge)
SP500 Daily Count #2
(Click on image to enlarge)
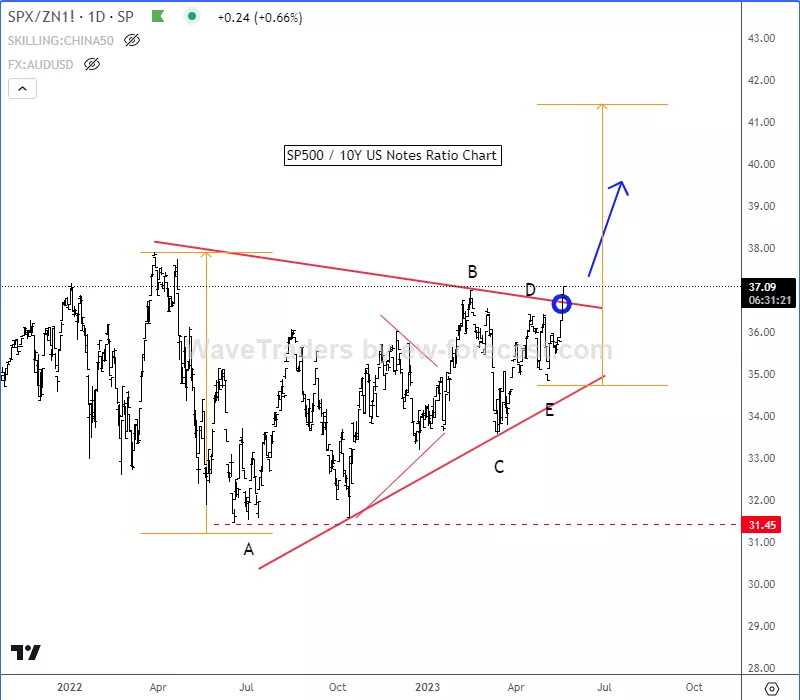
Even if we take a look on SPX/ZN (SP500 against 10Y US Notes) ratio chart, now that 10Y US Notes is slowing down and SP500 extending its rally, SPX/ZN ratio chart is finally breaking a larger bullish triangle pattern. It means that stocks will be doing much better than bonds in upcoming weeks/months.
(Click on image to enlarge)
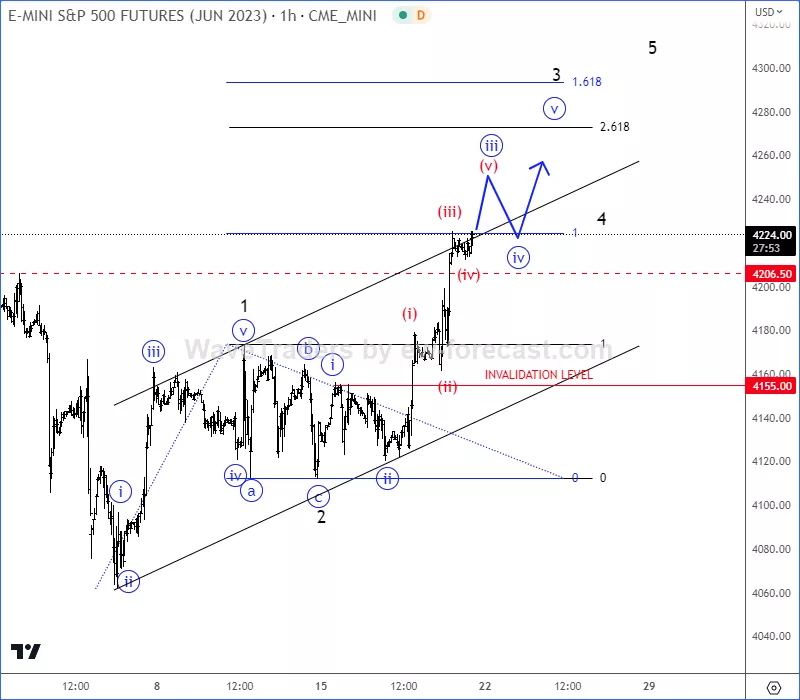
On the intraday basis SP500 is breaking higher above 4206 level, which means that can it be now unfolding a new intraday bullish impulse. We are tracking wave »iii« of 3 that can push the price up to 4270 – 4300 area, just be aware of 4th wave pullbacks. As long as the price is above 4155 invalidation level, we can expect a bullish continuation.
(Click on image to enlarge)
More By This Author:
Broken Channel Support On The EURUSD Can Cause Deeper Correction
NZDUSD Is Looking For Lower Support
Ethereum Slowed Down Within An A-B-C Correction


Comments
Log in or sign up to join the conversation.