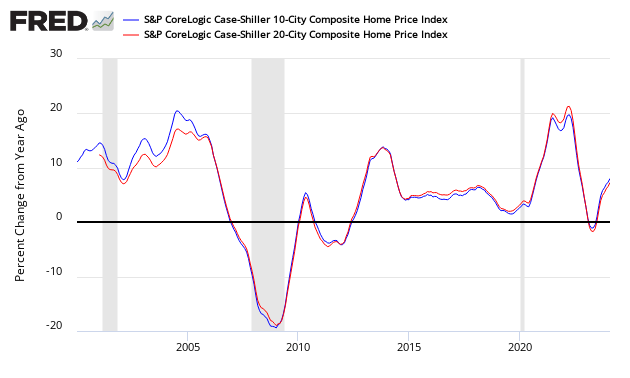
S&P CoreLogic Case-Shiller 20 City Home Price Index June 2019 Year-Over-Year Growth Slows To 2.1%
The non-seasonally adjusted S And P CoreLogic Case-Shiller home price index (20 cities) year-over-year rate of home price growth slowed from 2.4 % to 2.1 %. The index authors stated, "Home price gains continue to trend down, but may be leveling off to a sustainable level".

Analyst Opinion of Case-Shiller HPI
The continued slowing of the year-over-year growth rate is good news for the economy. Note that the NAR's existing home prices are trending up - the exact opposite of Case-Shiller.
- 20 city unadjusted home price rate of growth decelerated 0.3 % month-over-month. [Econintersect uses the change in year-over-year growth from month-to-month to calculate the change in the rate of growth]
- Note that the Case-Shiller index is an average of the last three months of data.
- The market expected from Econoday:
| Consensus Range | Consensus | Actual | |
| 20-city, SA - M/M | 0.2 % to 0.2 % | +0.2 % | +0.0 % |
| 20-city, NSA - M/M | 2.2 % to 2.7 % | +2.3 % | +0.3 % |
| 20-city, NSA - Yr/Yr | 2.4 % to 3.5 % | +2.6 % | +2.1 % |
S&P/Case-Shiller Home Price Indices Year-over-Year Change

When asked what today's release means for the housing market, Dr. Ralph B. McLaughlin, deputy chief economist, and executive of research and insights for CoreLogic said:
While falling mortgage rates have thus far only led to an increase in refinancing, rather than purchase activity, there will undoubtedly be a large boon to the marginal homebuyer. Thus, we should expect the lengthy slowdown in home price growth to flatten or even tick upwards by the end of the year assuming the U.S. economy avoids any present-day threats of a recession
Comparing the NAR and Case-Shiller home price indices, it needs to be understood each of the indices uses a unique methodology in compiling their index - and no index is perfect.
The way to understand the dynamics of home prices is to watch the direction of the rate of change. Here home price growth generally appears to stabilize (rate of growth not rising or falling).
There are some differences between the indices on the rate of "recovery" of home prices.
A synopsis of Authors of the Leading Indices:
Case Shiller's Philip Murphy, Managing Director and Global Head of Index Governance at S&P Dow Jones Indices:
Home price gains continue to trend down, but may be leveling off to a sustainable level. The average YOY gain declined to 3.0% in June, down from 3.1% the prior month. However, fewer cities (12) experienced lower YOY price gains than in May (13).
The southwest (Phoenix and Las Vegas) remains the regional leader in home price gains, followed by the southeast (Tampa and Charlotte). With three of the bottom five cities (Seattle, San Francisco, and San Diego), much of the west coast is challenged to sustain YOY gains. For the second month in a row, however, only Seattle experienced outright decline with YOY price change of -1.3%. The U.S. National Home Price NSA Index YOY price change in June 2019 of 3.1% is exactly half of what it was in June 2018. While housing has clearly cooled off from 2018, home price gains in most cities remain positive in low single digits. Therefore, it is likely that current rates of change will generally be sustained barring an economic downturn.
CoreLogic believes affordability is now improving (June 2019 Data). Per Dr. Frank Nothaft, chief economist at CoreLogic and Frank Martell, president and CEO of CoreLogic stated:
Tepid home sales have caused home prices to rise at the slowest pace for the first half of a year since 2011. Price growth continues to be faster for lower-priced homes, as first-time buyers and investors are both actively seeking entry-level homes. With incomes up and current mortgage rates about 0.8 percentage points below what they were one year ago, home sales should have a better sales pace in the second half of 2019 than a year earlier, leading to a quickening in price growth over the next year.
Millennial homebuyers are no longer a trend on the industry horizon. In fact, they are the new, first-time homebuyers of today. However, only about half of recent millennial buyers were satisfied with the number of options of available homes in their market or price range. Affordable housing continues to be a growing issue. A deeper look at the data shows that 43% of those surveyed indicated they couldn't afford to buy a new home or are concerned they won't be able to.
The National Association of Realtors says (July 2019 data):
"Falling mortgage rates are improving housing affordability and nudging buyers into the market," said Lawrence Yun, NAR's chief economist. However, he added that the supply of affordable housing is severely low. "The shortage of lower-priced homes have markedly pushed up home prices."
"Clearly, the inventory of moderately-priced homes is inadequate and more home building is needed," said Yun. "Some new apartments could be converted into condominiums thereby helping with the supply, especially in light of new federal rules permitting a wider use of Federal Housing Administration (FHA) mortgages to buy condo properties."
"Mortgage rates are important to consumers, but so is confidence about the nation's overall economic outlook," Yun continued. "Home buying is a serious long term decision and current low or even lower future mortgage rates may not in themselves meaningfully boost sales unless accompanied by improved consumer confidence."
"Present rates have opened the market for a number of potential buyers who couldn't afford a home just a year ago," said NAR President John Smaby, a second-generation Realtor from Edina, Minnesota, and broker at Edina Realty. "Additionally, NAR has been working with the FHA for years to establish new condominium loan policies. Our hard work has paid off, and this change will begin benefiting buyers, sellers and our members as soon as this fall."
The U.S. Federal Housing Finance Agency produces an All-Transactions House Price Index for the United States:

Econintersect publishes knowledgeable views of the housing market.
Caveats on the Use of Home Price Indices
The housing price decline seen since 2005 varies by zip code - and seems to have ended somewhere around the beginning of the 2Q2012. Every area of the country has differing characteristics. Since January 2006, the housing declines in Charlotte and Denver are well less than 10%, while Las Vegas home prices had declined almost 60%.
Each home price index uses a different methodology - and this creates slightly different answers.
The most broadly based index is the US Federal Housing Finance Agency's House Price Index (HPI) - a quarterly broad measure of the movement of single-family house prices. This index is a weighted, repeat-sales index on the same properties in 363 metro centers, compared to the 20 cities Case-Shiller.
The US Federal Housing Finance Agency also has an index (HPIPONM226S) based on 6,000,000 same home sales - a much broader index than Case-Shiller. Also, there is a big difference between home prices and owner's equity (OEHRENWBSHNO) which has been included in the graph below.
Comparing Various Home Price Indices to Owner's Equity (blue line)


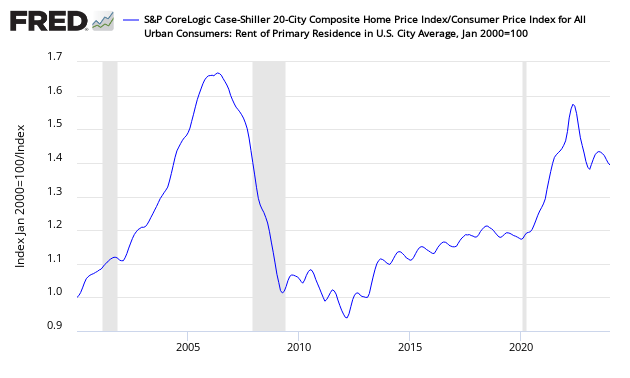
The affordability factor favors rental vs owning.
Price to Rent Ratio - Indexed on January 2000 - Based on Case-Shiller 20 cities index ratio to CPI Rent Index

Disclaimer: No content is to be construed as investment advise and all content is provided for informational purposes only.The reader is solely responsible for determining whether any investment, ...
more


House prices are teetering.