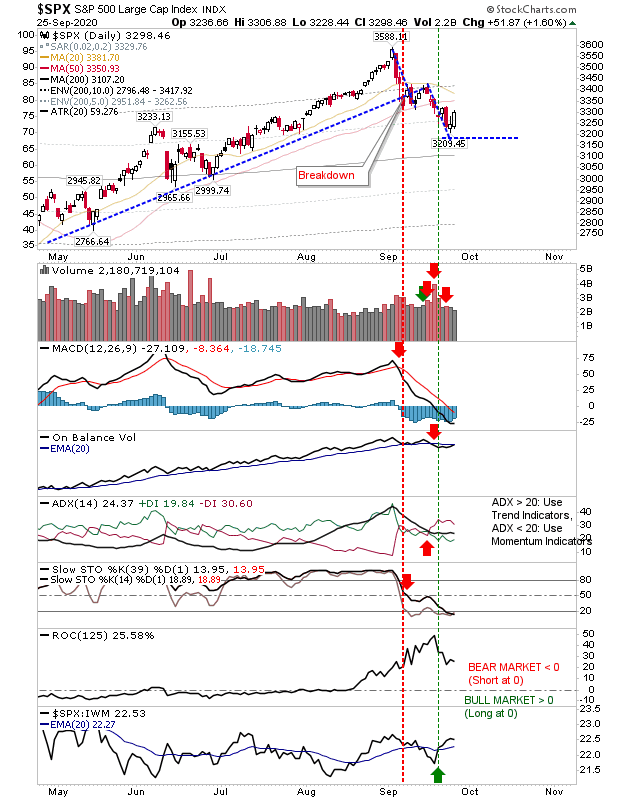
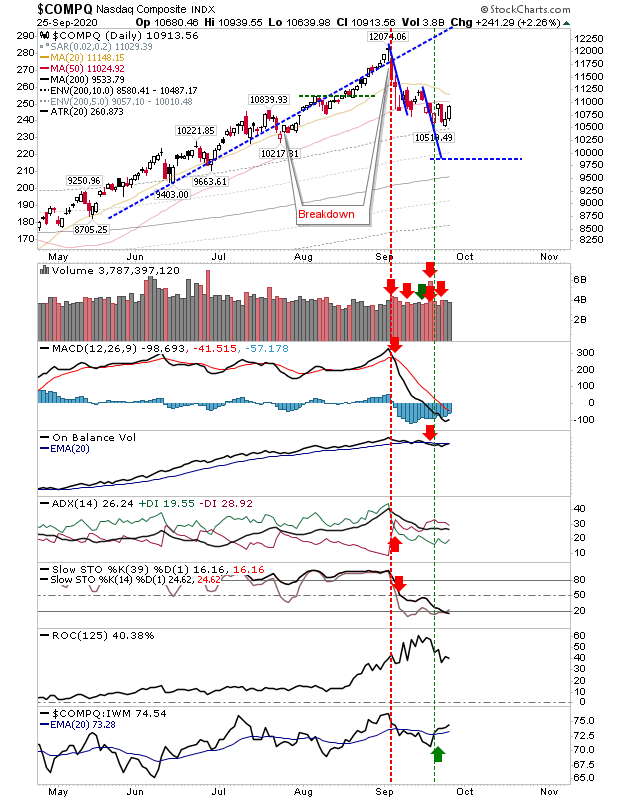
S&P Bounces At Measured Move Target
An easy headline which has played out as true, although the same bounce occurred in the Nasdaq well before the measured move target is reached. In the case of the S&P, the measured move target is above the 200-day MA - a typical support level and a more likely area for a bounce - so it remains to be seen if this bounce will hold but it does provide a level to set protective stops (for existing positions in the S&P and member stocks). Note, technicals are all net negative and aren't really in support of a bounce, with the exception of short-term and intermediate stochastics which have converged at an oversold state.
The Nasdaq bounce is also occurring in a backdrop of negative technicals and low buying volume. It's a bounce which has occurred relatively early in the decline, increasing the chance for a successful bounce, but the only technical support for this outcome is relative performance and stochatics. Although there is a breadth metric running in its favor.
The Russell 2000 managed to dig in a support of its 200-day MA which also marked an oversold state in stochastics. As with other peer indices, there isn't the supporting volume from buyers to suggest a bounce is sustainable but one can only go with market action. Friday's action does give existing long holders s place to raise or set stops.
Next week will be critical in determining if Friday's buying was nothing more than a flash in the pan. The indices most likely to succeed - in order of probability - are the Russell 2000, S&P, and Nasdaq.


