S&P 500 Testing An Important Area
Retests Can Occur After Breakouts
Typically, when markets break out from long-term consolidation boxes, it tells us something has fundamentally changed. However, the fundamental drivers that kept the market contained in the consolidation box may still need one more shakeout or retest before the market can push higher.
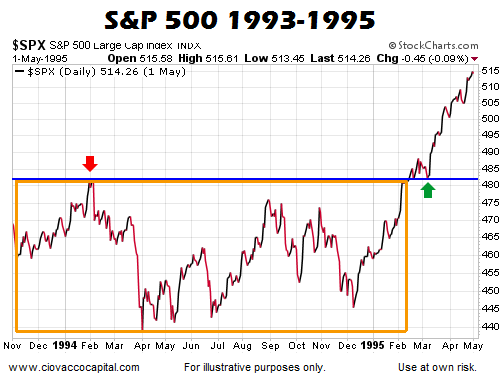
For example, after the S&P 500 went basically nowhere between November 1993 and February 1995, the bulls finally mustered enough conviction to push price above the orange box below. After the bullish breakout from the long-term range, sellers needed one more shakeout before the market pushed higher. The retest occurred above the green arrow.

The purpose of showing the chart above is to provide a generic example of a retest. We are not making any attempt to compare 1995 to 2016. Yes, 2016 is quite different than 1995. However, that concept applies to all historical market references.
2016: Stocks Returning To Breakout Area
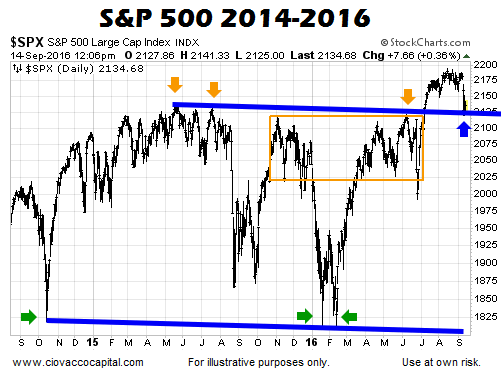
There are numerous ways to define a long-term market consolidation, including using a trend channel. The S&P 500 stayed contained within the two blue parallel lines below between October 2014 and July 2016 (see orange and green arrows below). After breaking out, the S&P 500 pushed higher and is now “retesting” the upper part of the blue trend channel. If the market moves back into the trend channel, the next layer of possible support falls within the orange box.

Interest Rate Expectations
Given the rather low market expectations for a September interest rate hike, recent volatility may have a “should we be getting concerned about inflation” component. From Bloomberg:
Treasuries rallied Wednesday as traders gained confidence that the Federal Reserve will keep interest rates steady at least through next week’s policy meeting. Traders are favoring shorter maturities as a Fed on hold is seen as potentially stoking inflation, which erodes the value of long-term debt. Futures signal barely a one-in-five chance that the Fed will tighten policy this month amid tepid economic growth and restrained inflation.
Monthly Levels Of Note
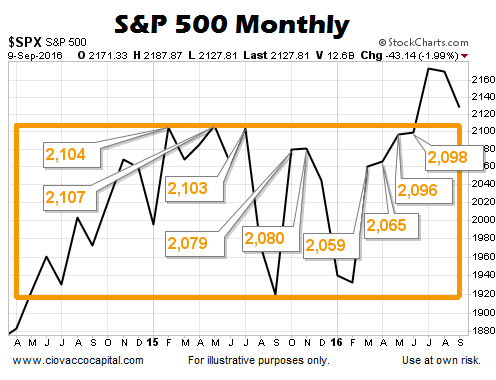
Weekly levels for the S&P 500 and SPY were covered on September 13. We can also learn something by examining monthly closing levels near the top of the orange consolidation box. If the market wants to drop further, something that is quite possible with inflation data and a Fed meeting on the horizon, the monthly band of possible support falls between 2,107, and 2,059.

A September 9 video clip provides additional historical examples of volatility that followed breakouts from long-term consolidation boxes.
Disclosure: This post contains the current opinions of the author but not necessarily those of Ciovacco Capital Management. The opinions are subject to change ...
more


Thanks for sharing