
S&P 500 Snapshot: Tuesday Bounce
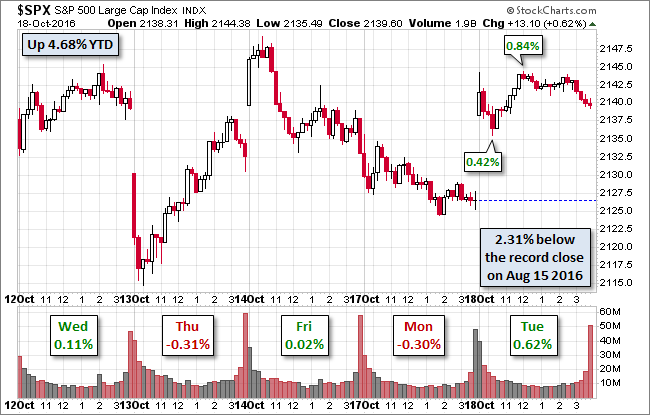
Today most major equity indexes around the globe bounced back after Monday's weak start to the week. The Shanghai Composite surged 1.38%, the Euro STOXX 50 closed with a 1.27% advance. Our benchmark S&P 500 jumped at the open, sold off to its 0.42% intraday low near the end of the first hour of trading and rallied to its 0.84% mid-day high. It then traded sideway until the final hour, when some selling trimmed the closing gain to 0.62% — a welcome advance, but not as impressive as some of its key Asian and European index cousins.
The yield on the 10-year note closed at 1.75%, down two BPs from the previous close.
Here is a snapshot of past five sessions in the S&P 500.
(Click on image to enlarge)
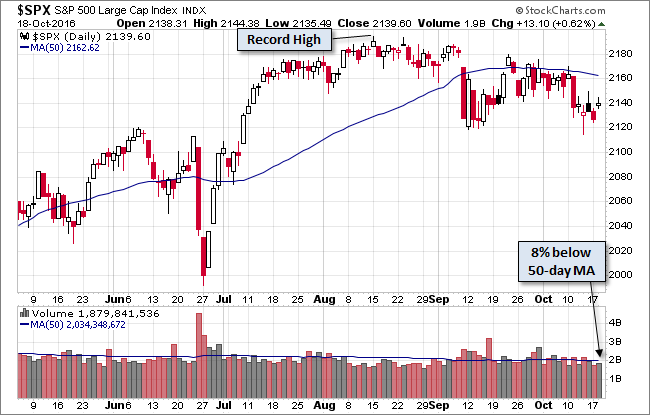
Here's a daily chart of the S&P 500. Today's trading volume was again on the light side.
(Click on image to enlarge)
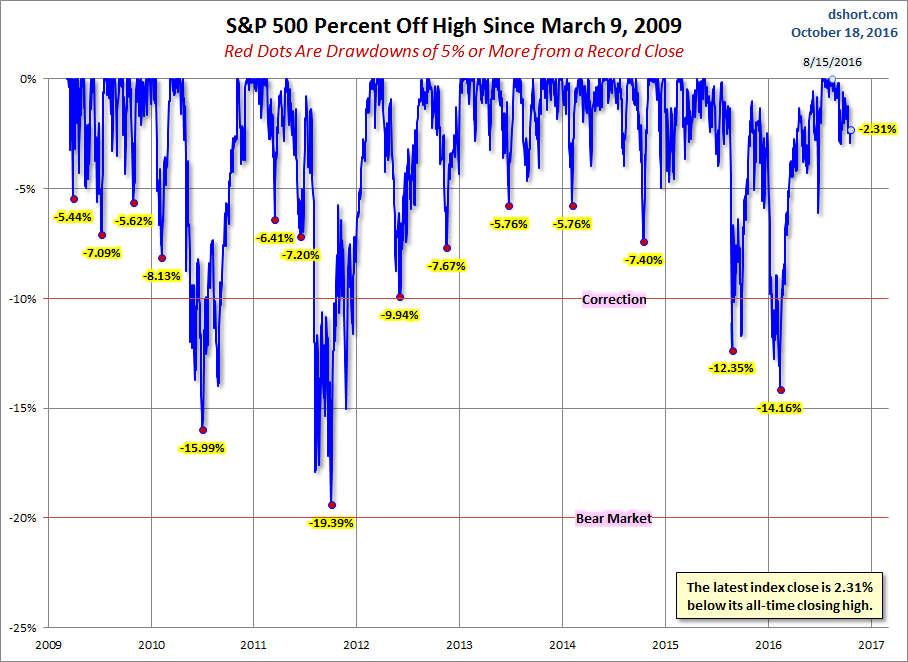
A Perspective on Drawdowns
Here's a snapshot of selloffs since the 2009 trough.
(Click on image to enlarge)
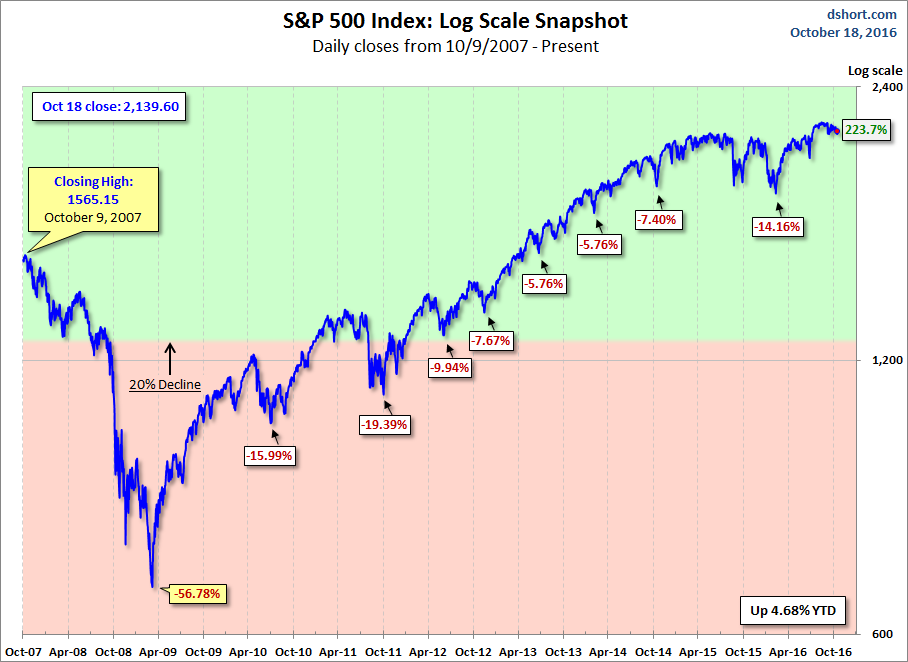
Here is a more conventional log-scale chart with drawdowns highlighted.
(Click on image to enlarge)
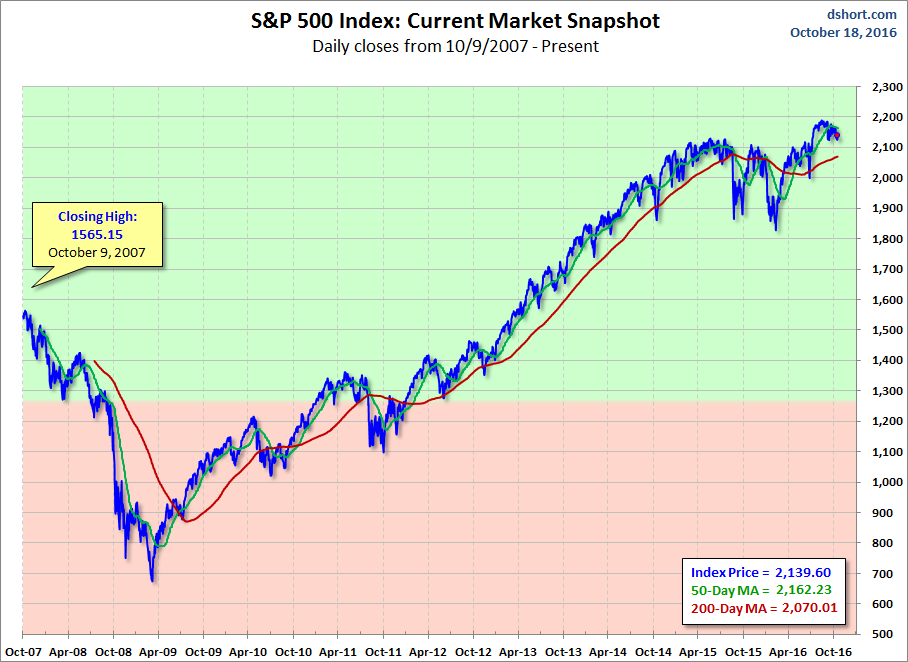
Here is a linear scale version of the same chart with the 50- and 200-day moving averages.
(Click on image to enlarge)
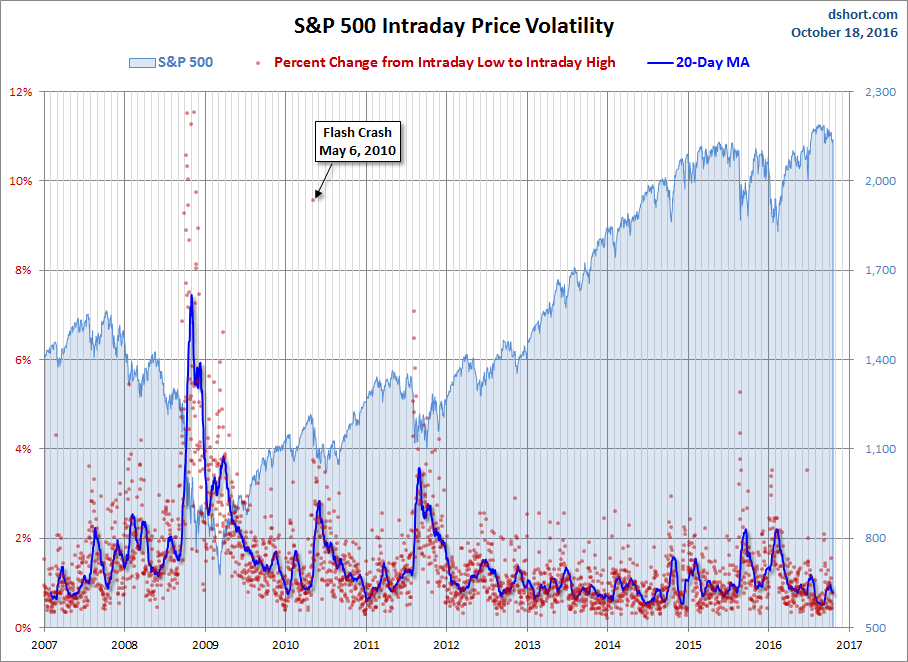
A Perspective on Volatility
For a sense of the correlation between the closing price and intraday volatility, the chart below overlays the S&P 500 since 2007 with the intraday price range. We've also included a 20-day moving average to help identify trends in volatility.
(Click on image to enlarge)
Disclosure: None.


Thanks for sharing