
S&P 500 Snapshot: Treading Water Before Jobs Friday
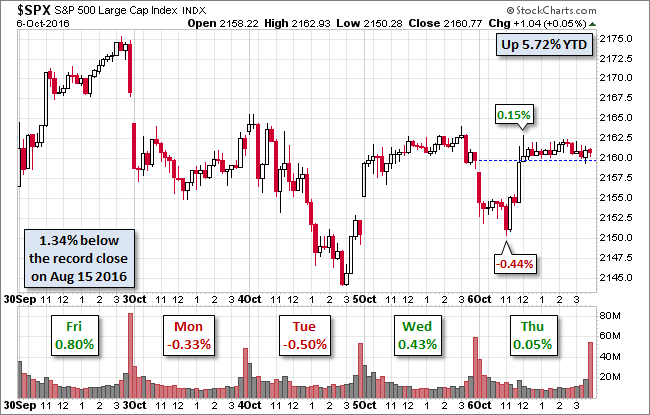
Futures were pointing lower at 8:30 AM when this morning's weekly jobless claims report was released. Despite a stronger than forecast report, the S&P 500 opened lower and sold off to its -0.44% intraday low about 90 minutes into the session. The index then bounced back above Wednesday close level and spent the afternoon in a narrow trading between its 0.15% intraday high and the flatline (i.e., yesterday's close). The session ended just a few ticks above the flatline with a tiny 0.05% gain in advance of tomorrow's monthly employment report.
The yield on the 10-year note closed up three BPs at 1.75%, the highest closing yield since June 2nd.
Here is a snapshot of past five sessions in the S&P 500.
(Click on image to enlarge)
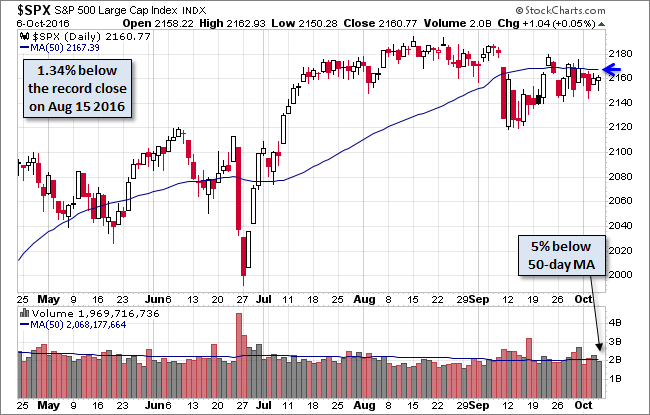
Here is a daily chart of the index. Volume was a bit light ahead of the employment report. The index remains below its 50-day price moving average, which is now sloping downward.
(Click on image to enlarge)
A Perspective on Drawdowns
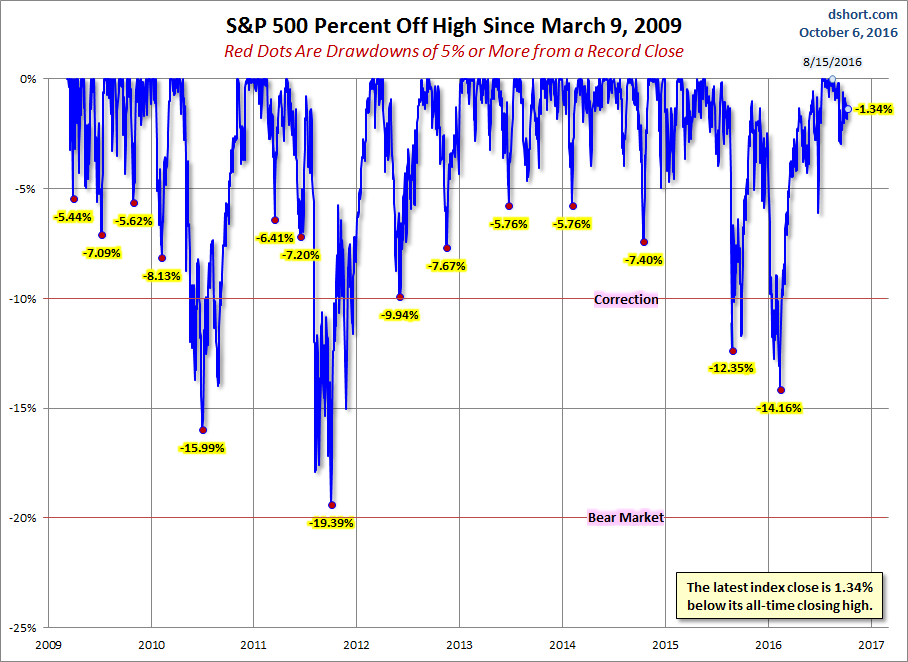
Here's a snapshot of selloffs since the 2009 trough.
(Click on image to enlarge)
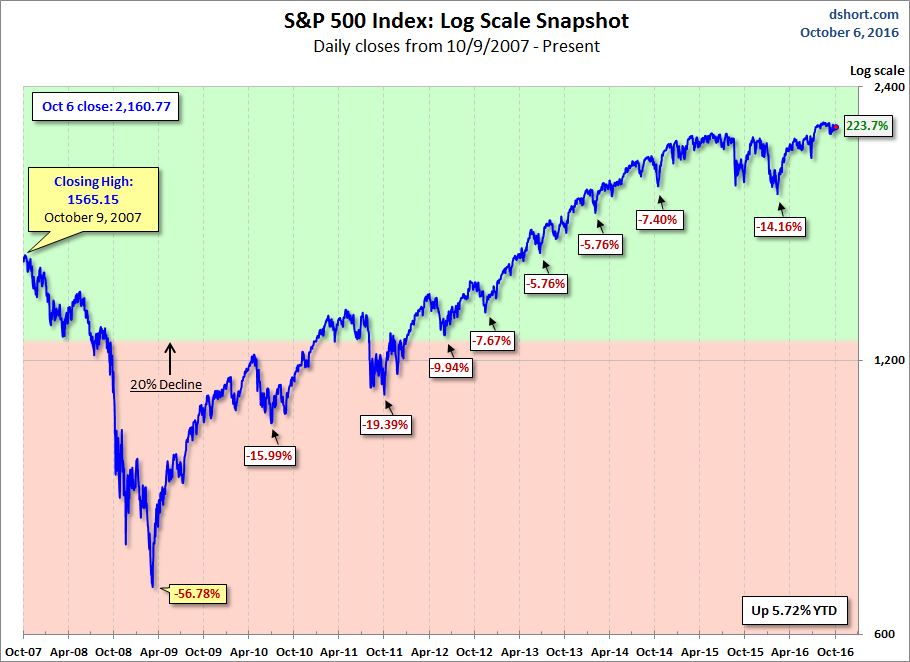
Here is a more conventional log-scale chart with drawdowns highlighted.
(Click on image to enlarge)
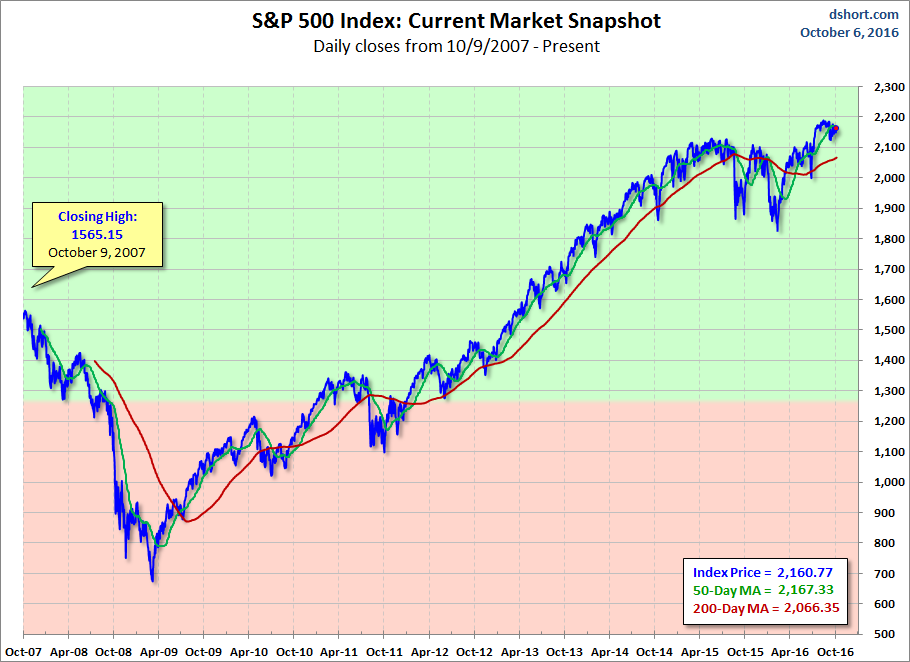
Here is a linear scale version of the same chart with the 50- and 200-day moving averages.
(Click on image to enlarge)
A Perspective on Volatility
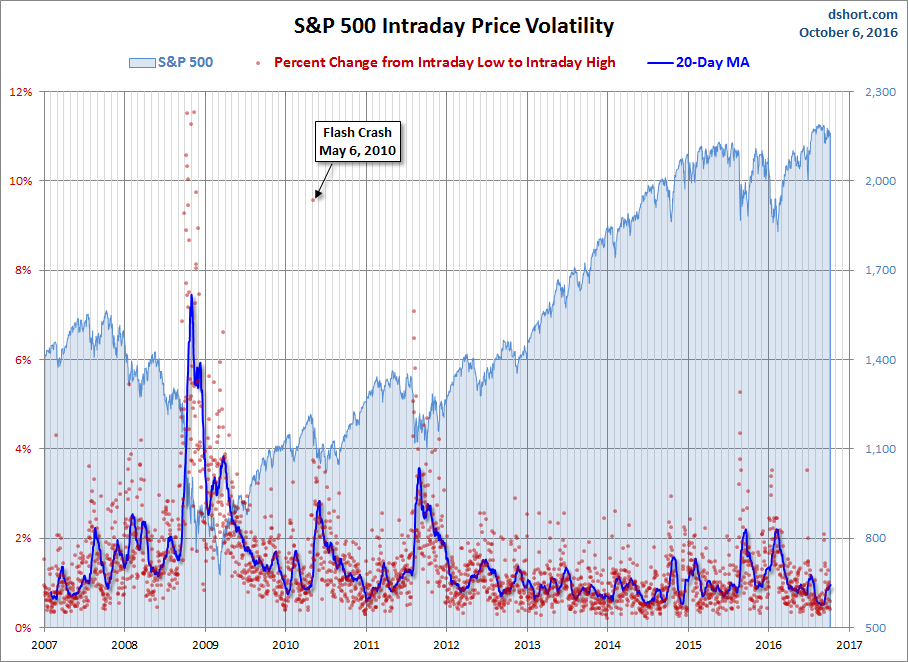
For a sense of the correlation between the closing price and intraday volatility, the chart below overlays the S&P 500 since 2007 with the intraday price range. We've also included a 20-day moving average to help identify trends in volatility.
(Click on image to enlarge)
Disclosure: None.


Thanks for sharing