
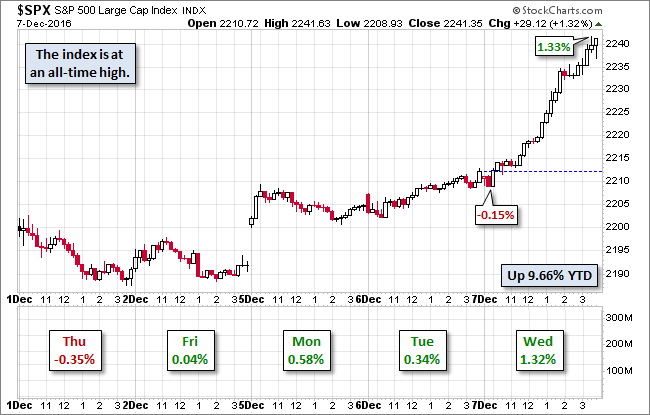
S&P 500 Snapshot: The Trump Rally Accelerates To Another Record Close
Equity indexes around the globe rallied today again today, and our benchmark S&P 500, along with its elderly cousin Dow, surged to new record closes. The 500 hesitated and the open, traded sideways until late morning and then began a steady soar to its 1.32% record close, just a tick off its intraday high. Today's equity surge coincided with President-Elect Trump's new accolade as Time's Person of the Year.
The yield on the 10-year note closed at 2.34%, down five BPs from its previous close.
(Click on image to enlarge)
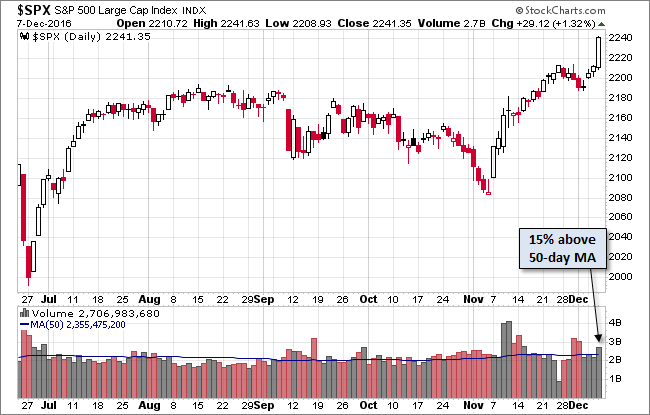
Here is a daily chart of the index. Trading volume rose on today's record close.
(Click on image to enlarge)
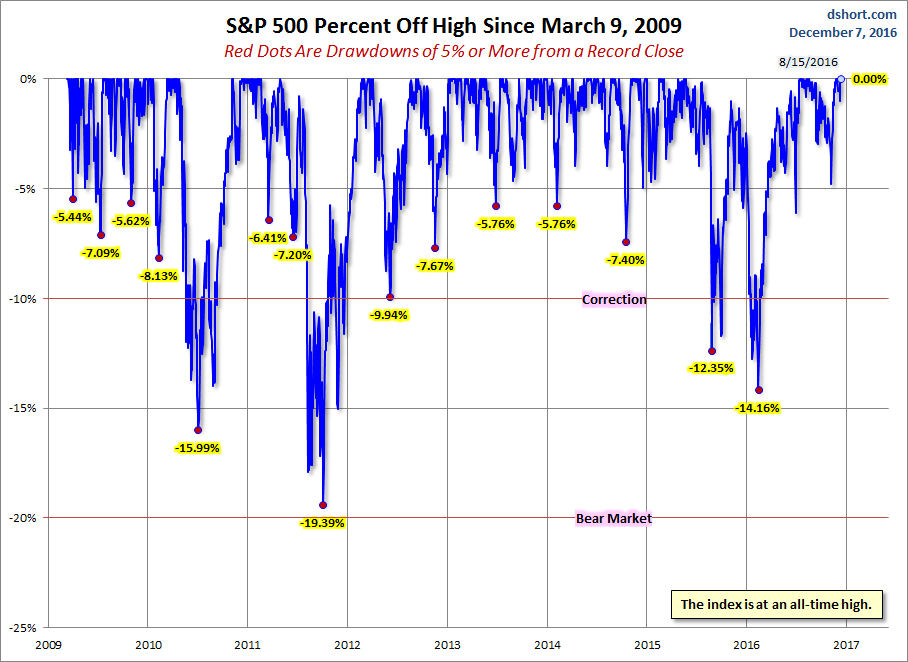
A Perspective on Drawdowns
Here's a snapshot of selloffs since the 2009 trough.
(Click on image to enlarge)
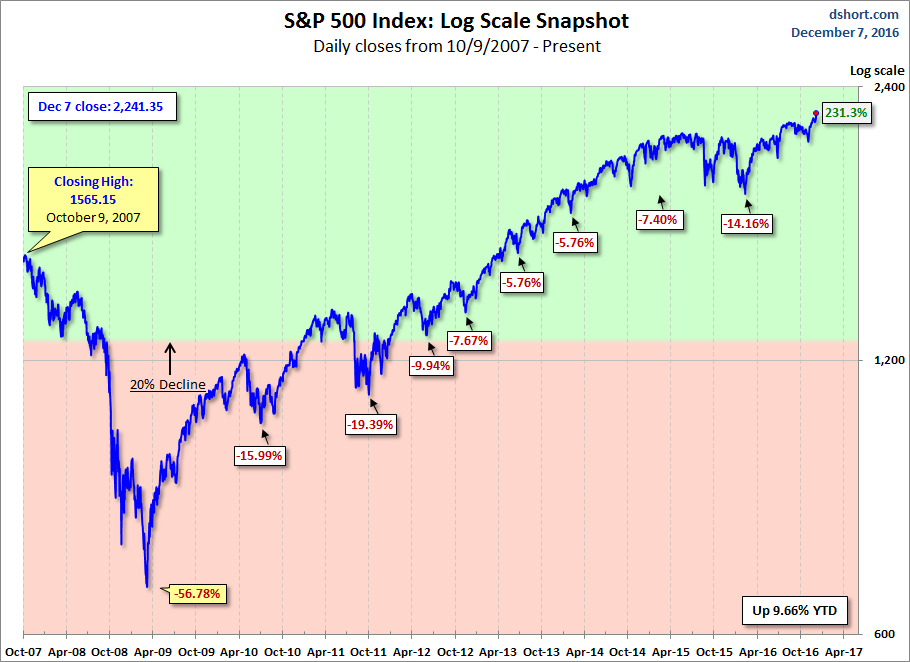
Here is a more conventional log-scale chart with drawdowns highlighted.
(Click on image to enlarge)
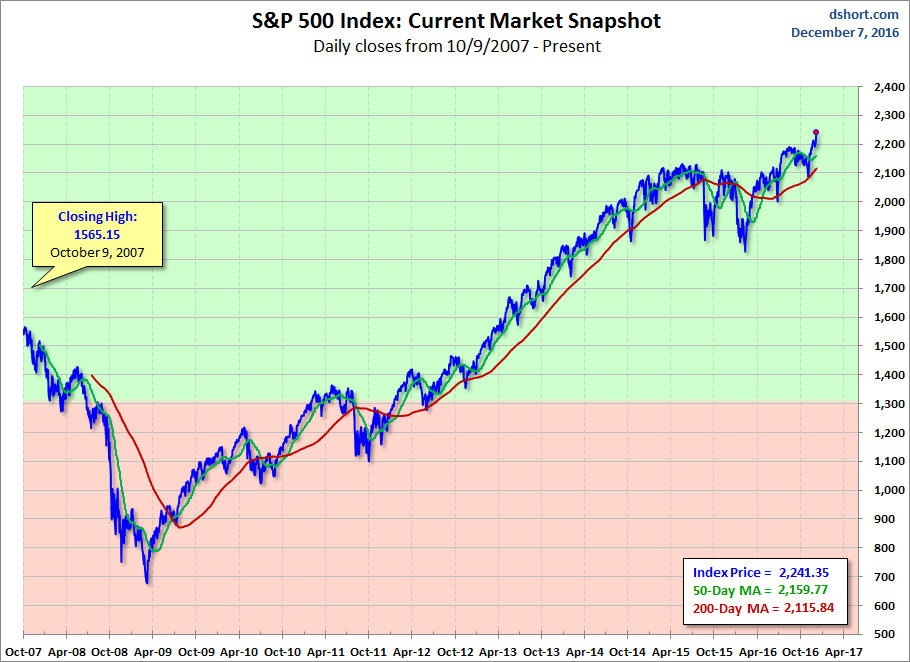
Here is a linear scale version of the same chart with the 50- and 200-day moving averages.
(Click on image to enlarge)
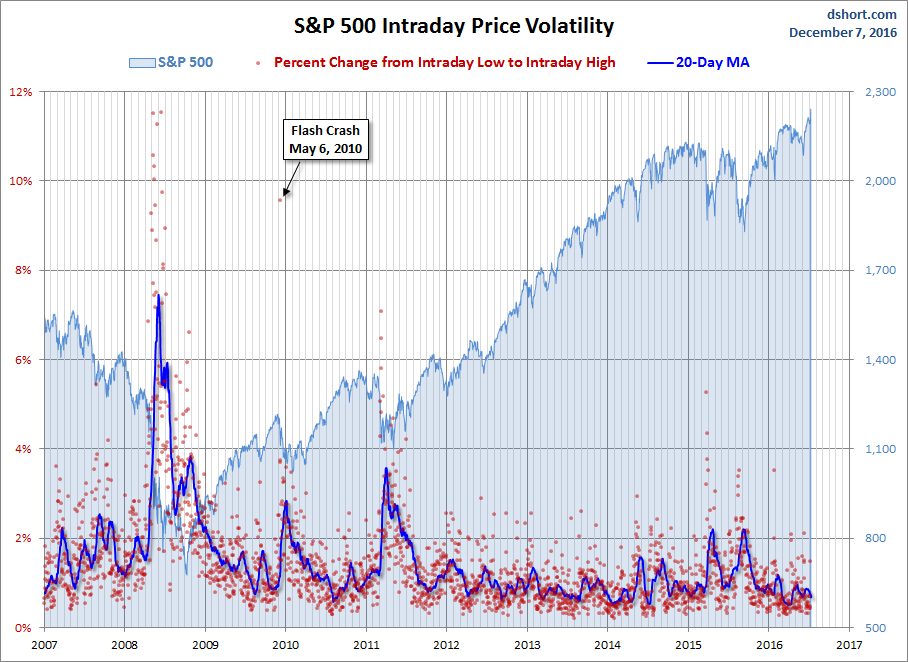
A Perspective on Volatility
For a sense of the correlation between the closing price and intraday volatility, the chart below overlays the S&P 500 since 2007 with the intraday price range. We've also included a 20-day moving average to help identify trends in volatility.
(Click on image to enlarge)
Disclosure: None.


Thanks for sharing