
S&P 500 Snapshot: The Election Rally Ends With A Modest Loss
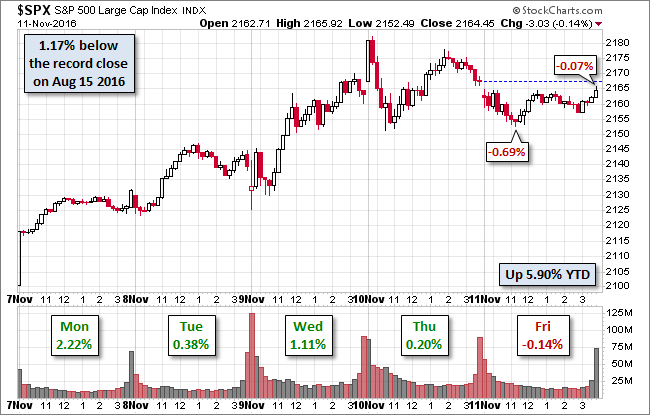
The downtrend in the S&P 500 that started Thursday afternoon continued at this morning's open with the index hitting its -0.69% intraday low near the end of the second hour of trading. The bounce that followed took the index to a relatively narrow trading range in the shallow red through the afternoon. A rise in the final hour raised the possibility that the pre/post-election rally would extend to a fifth day day, but it was not to be. The intraday high of -0.07% was close. The session ended at -0.14%.
The bond market was closed for Veterans Day.
Here is a snapshot of the past five sessions.
(Click on image to enlarge)
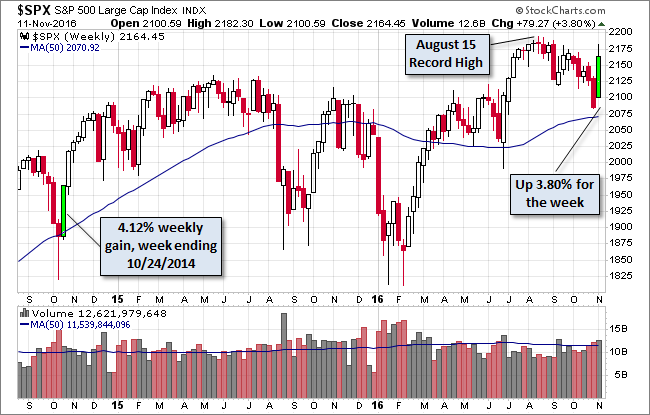
Here's a weekly chart of the index. The 3.80% weekly gain is the largest in over two years.
(Click on image to enlarge)
A Perspective on Drawdowns
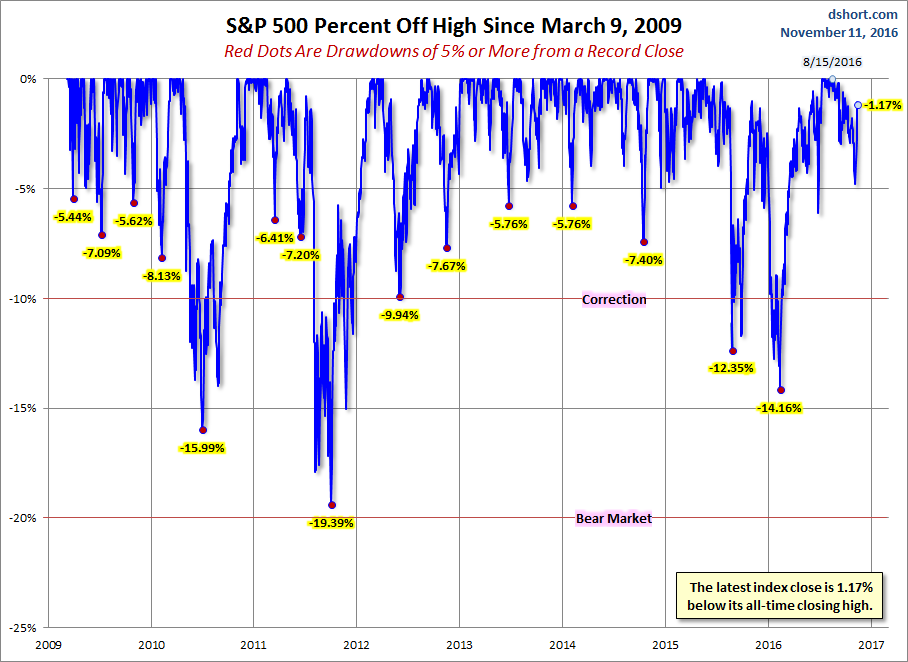
Here's a snapshot of selloffs since the 2009 trough.
(Click on image to enlarge)
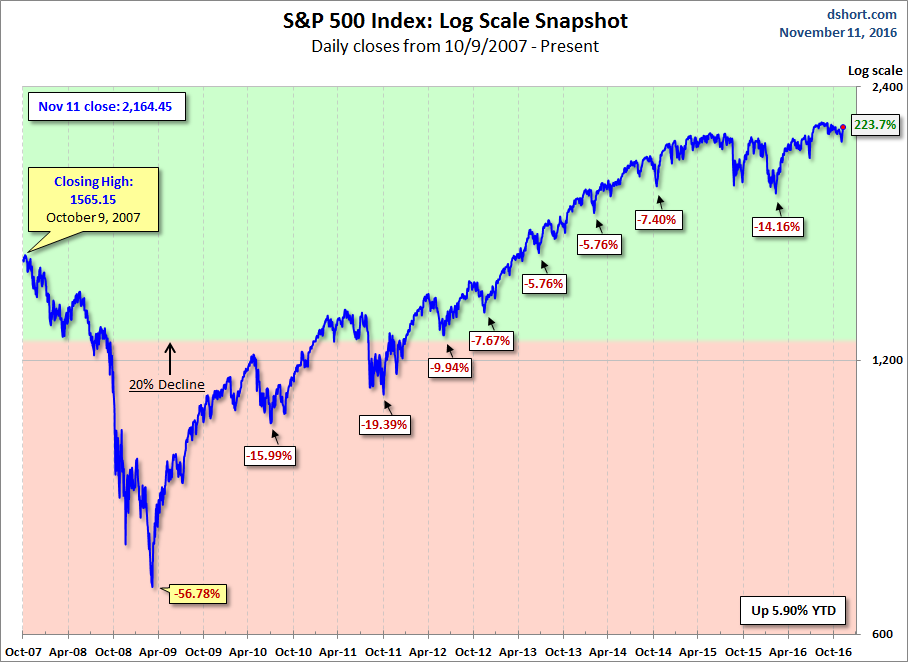
Here is a more conventional log-scale chart with drawdowns highlighted.
(Click on image to enlarge)
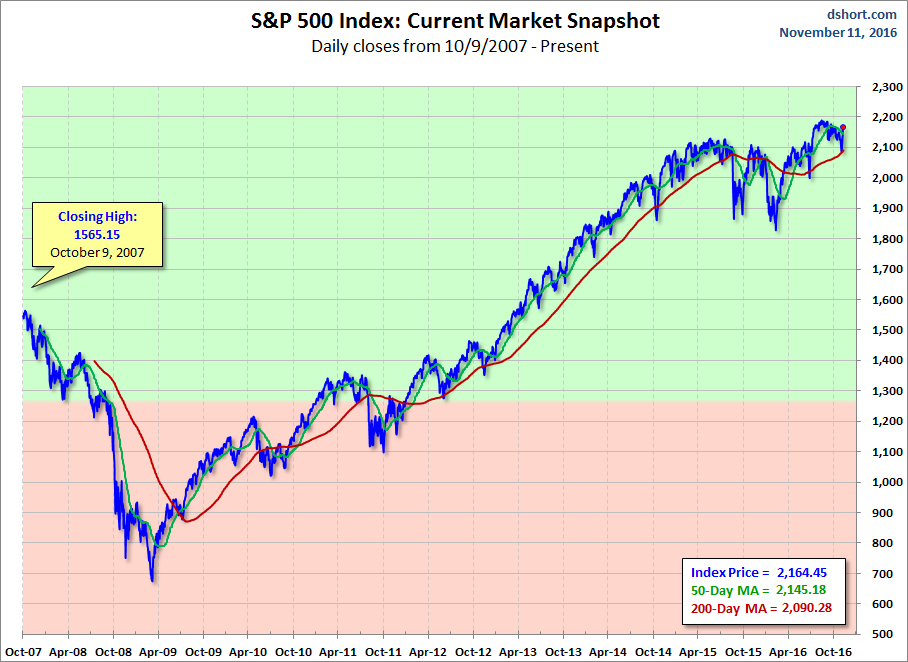
Here is a linear scale version of the same chart with the 50- and 200-day moving averages.
(Click on image to enlarge)
A Perspective on Volatility
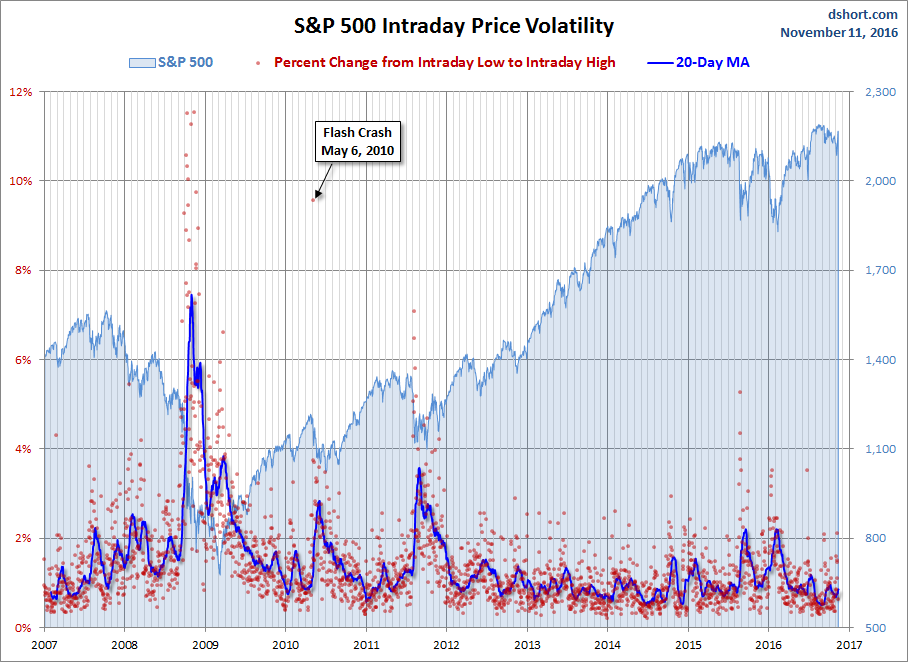
For a sense of the correlation between the closing price and intraday volatility, the chart below overlays the S&P 500 since 2007 with the intraday price range. We've also included a 20-day moving average to help identify trends in volatility.
(Click on image to enlarge)
Disclosure: None.


Thanks for sharing