
S&P 500 Snapshot: The Don Trumps Santa
Sorry, no Santa Claus Rally for 2016. Apparently Santa was trumped by the Don, who lifted the S&P 500 6.18% from the election-day close to its latest record close on December 13th. The index then remained relatively flat for the next eight sessions, slipping a modest 0.35% from the record close to the pre-Christmas close. Would Santa bring a rally over the next four sessions? Alas, it was not to be. Following the holiday Monday, the 500 posted a fractional 0.22% gain on Tuesday, but then closed with losses for the next three sessions, falling 1.10% for the traditional Santa rally time frame.
Here is a snapshot of the past five sessions.
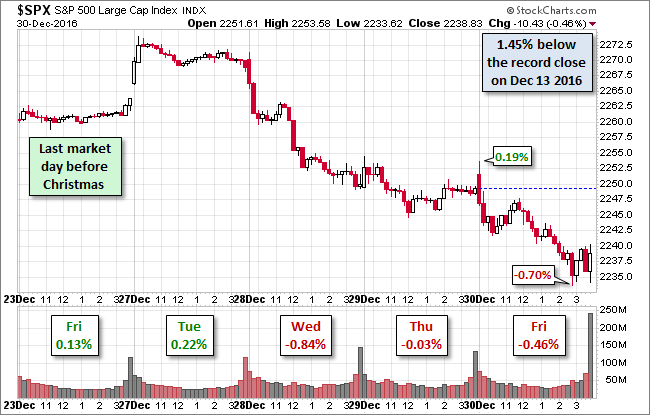
The yield on the 10-year note closed at 2.49%, down two BPs from its previous close and the lowest close in ten sessions.
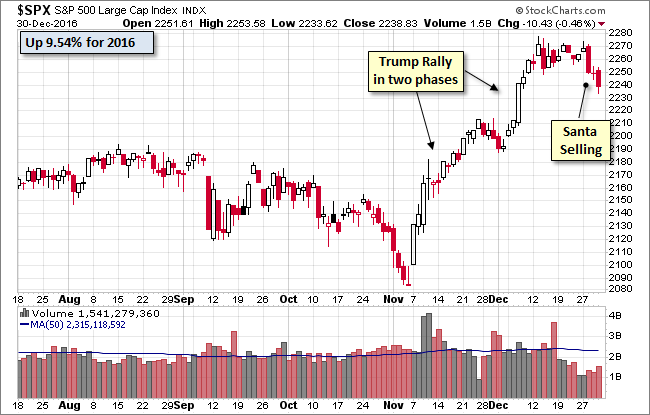
Here is daily chart of the index. We've highlighted the Trump Rally and the Santa Slump.
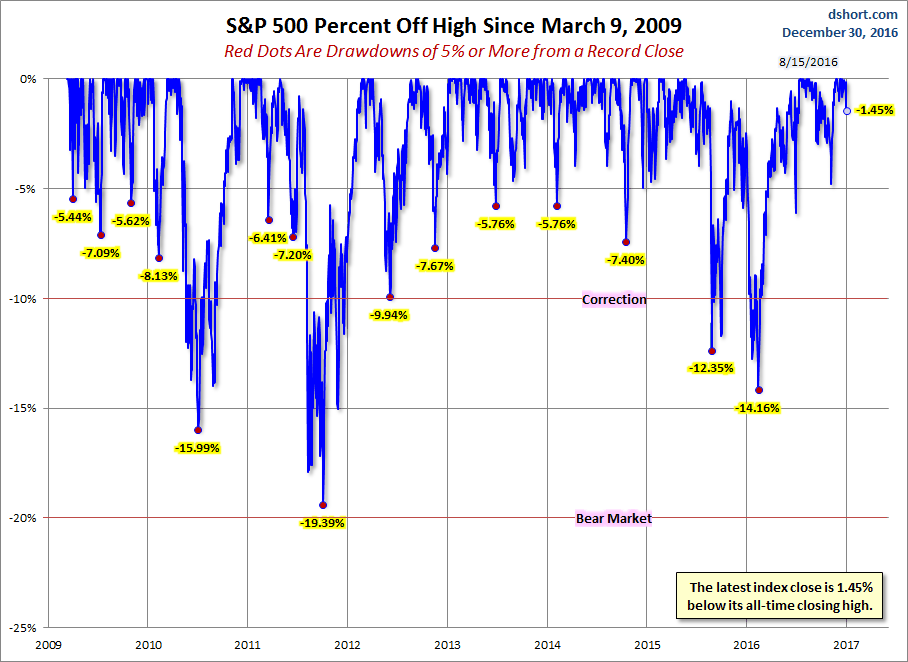
A Perspective on Drawdowns
Here's a snapshot of selloffs since the 2009 trough.
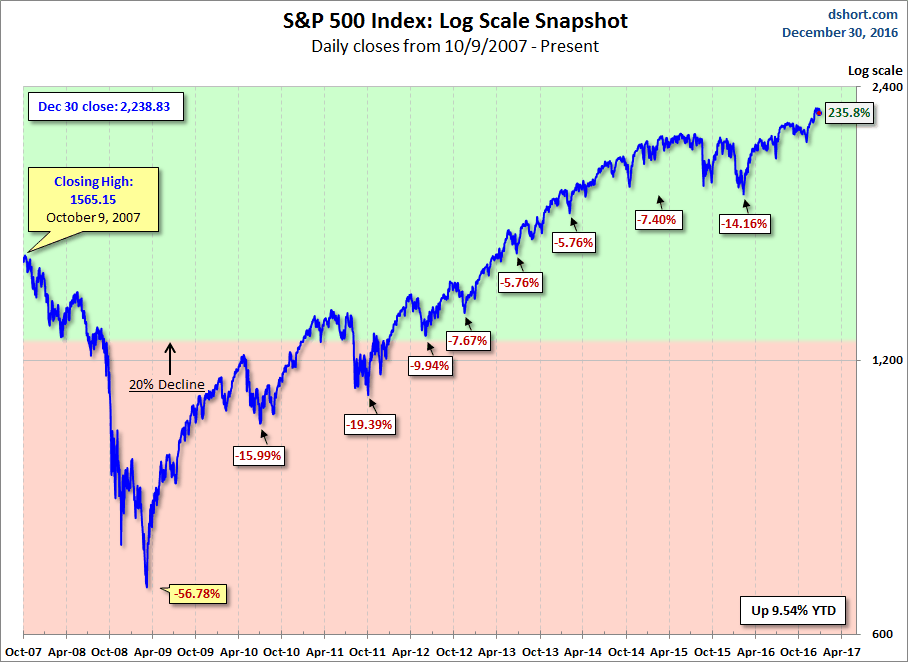
Here is a more conventional log-scale chart with drawdowns highlighted.
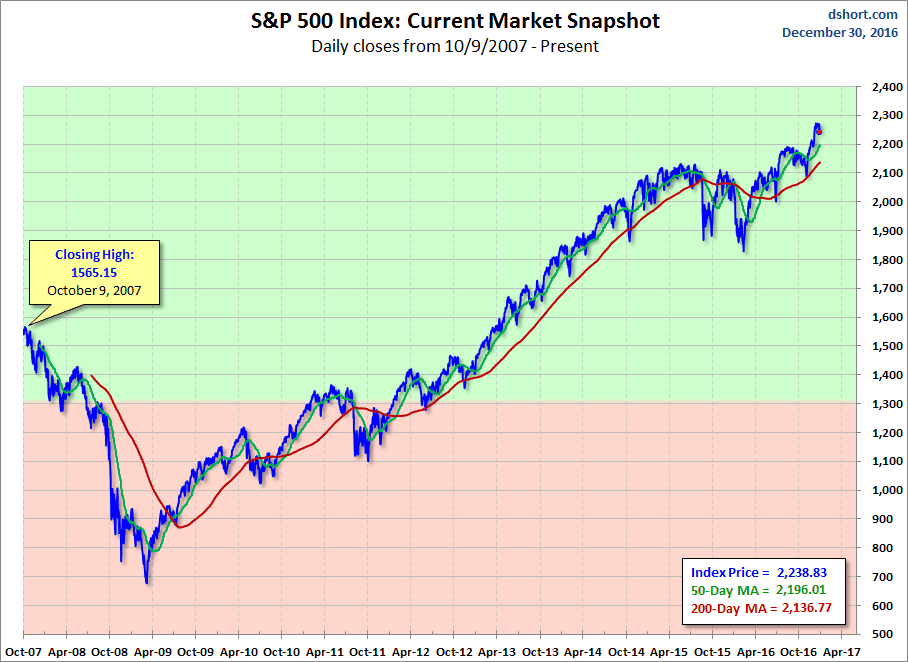
Here is a linear scale version of the same chart with the 50- and 200-day moving averages.
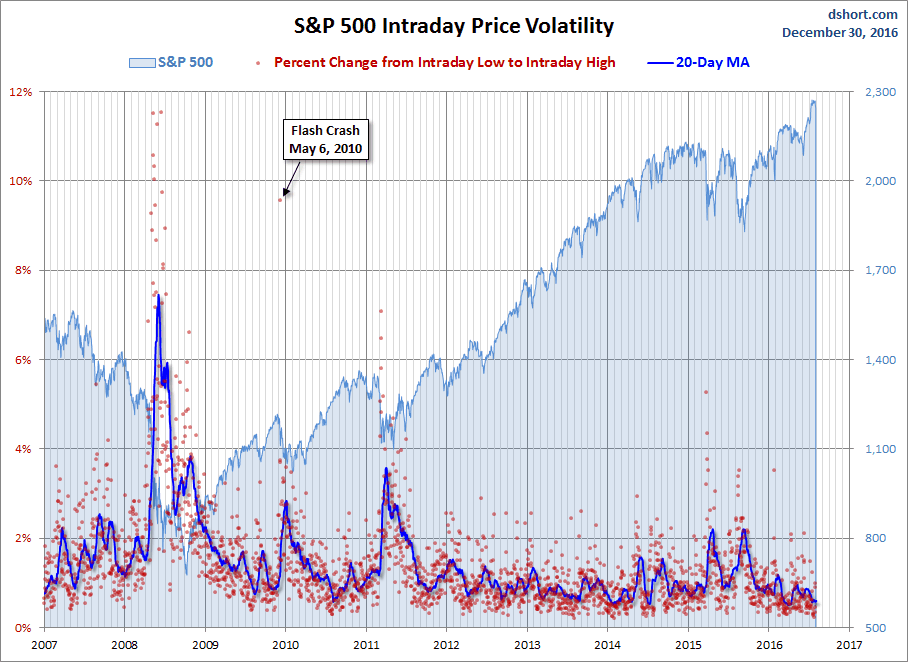
A Perspective on Volatility
For a sense of the correlation between the closing price and intraday volatility, the chart below overlays the S&P 500 since 2007 with the intraday price range. We've also included a 20-day moving average to help identify trends in volatility.
Disclosure: None.


Thanks for sharing. Happy New Year