
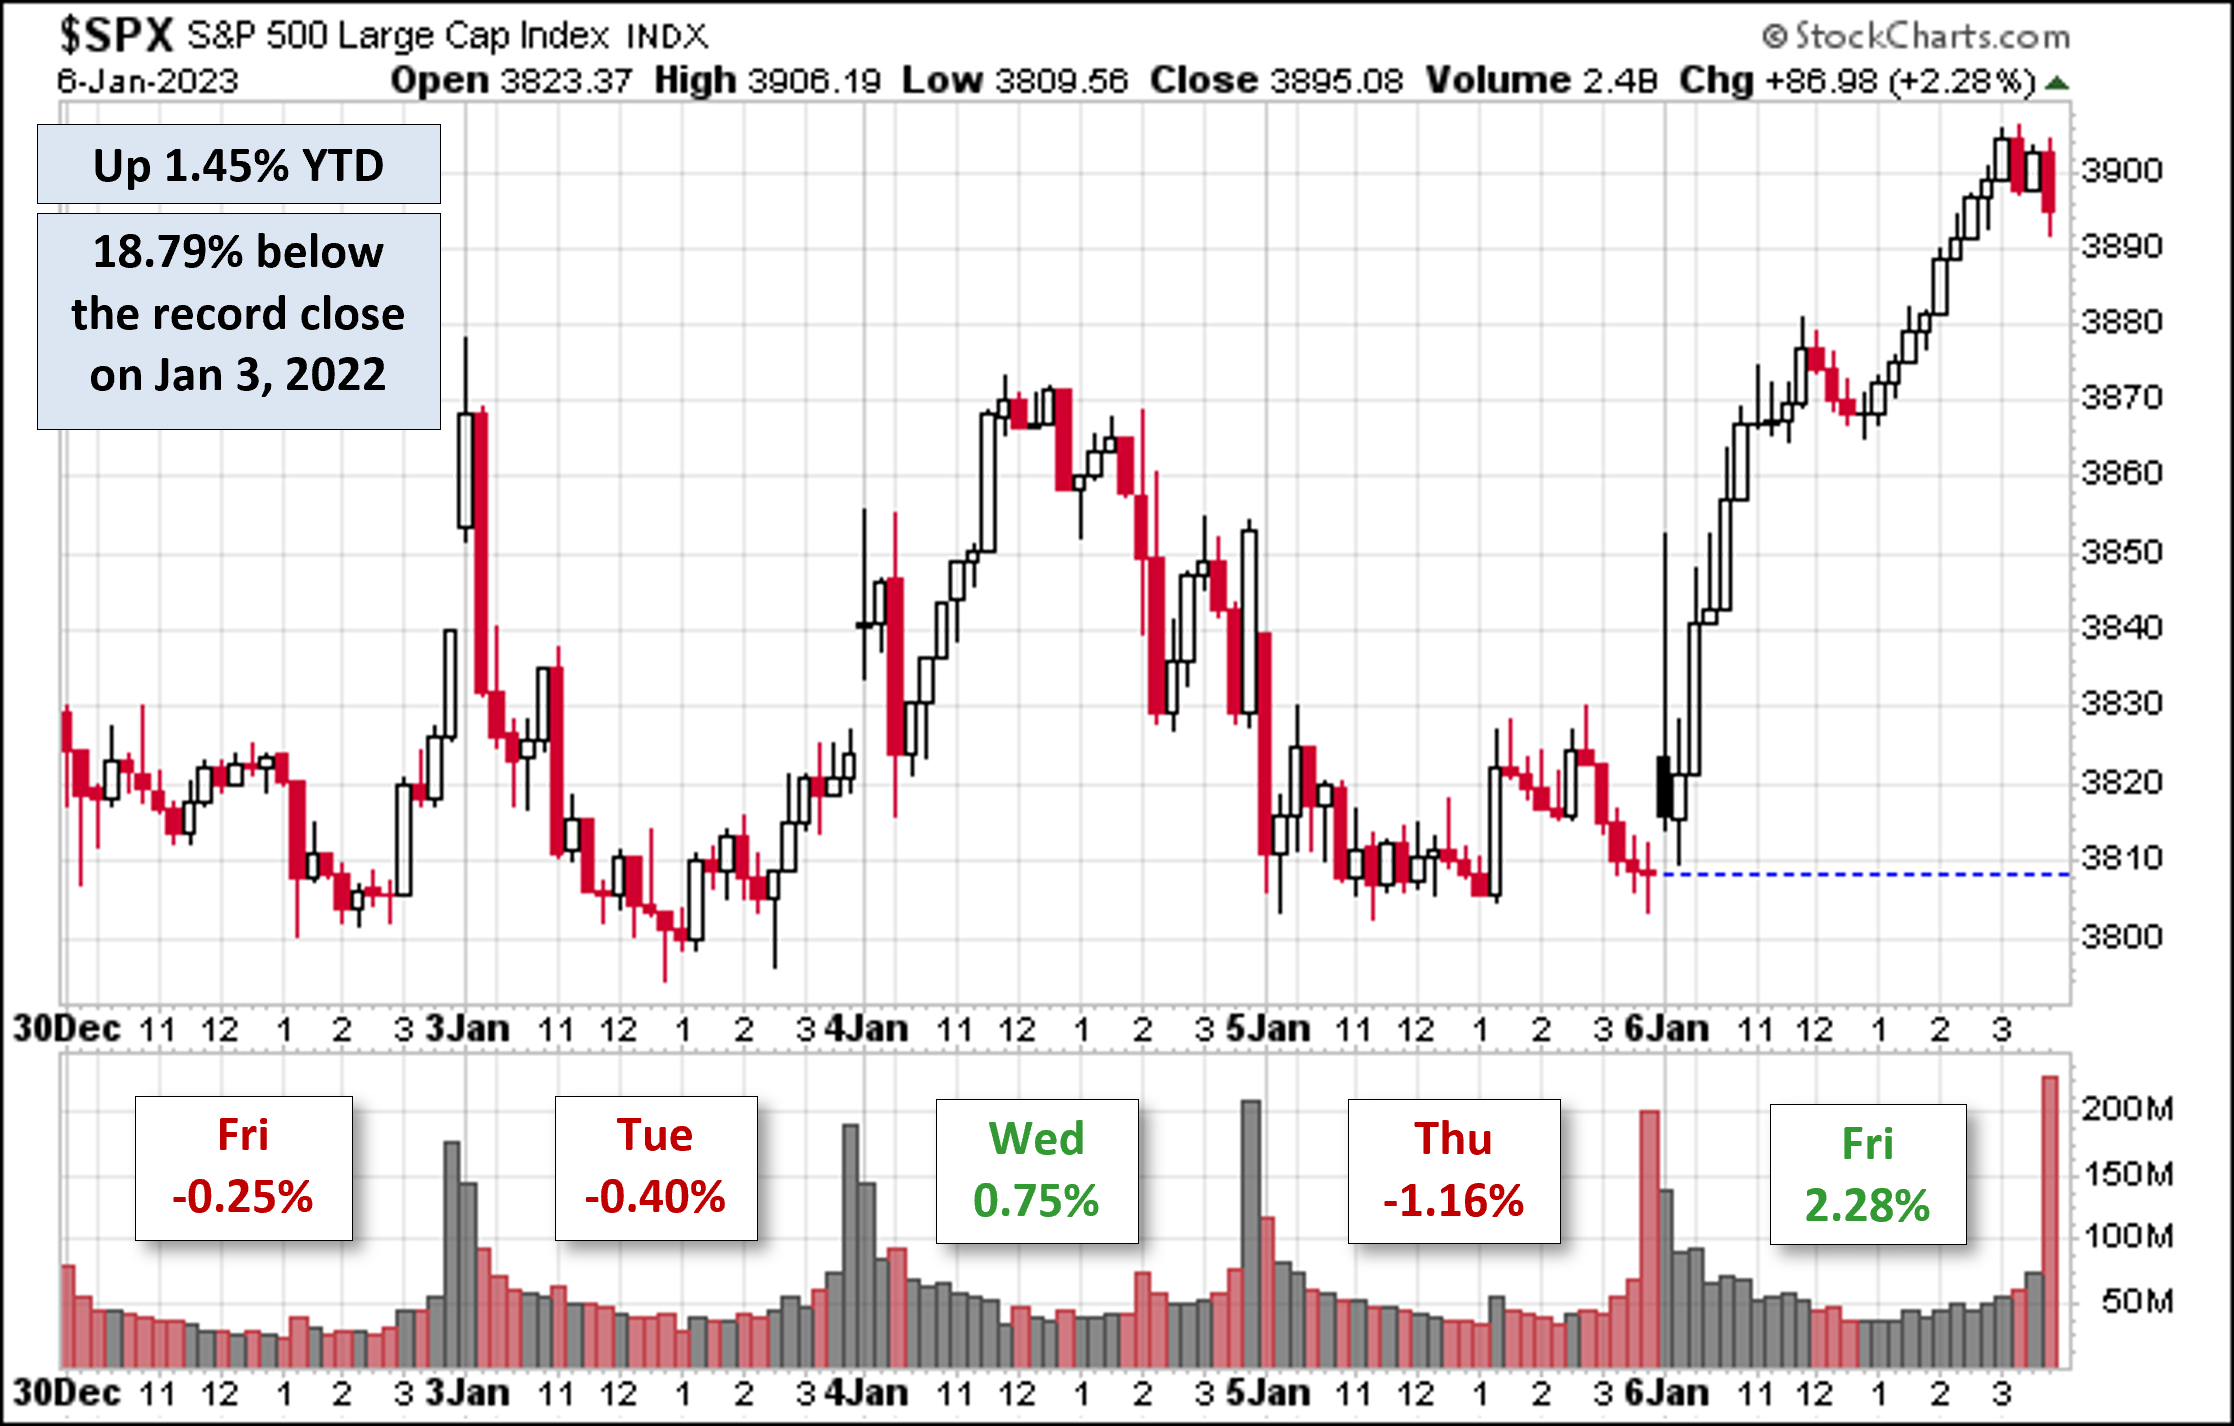
The S&P 500 rallied on Friday after a strong employment report for December. The index is up 2.28% from Thursday and is still 18.8% below its record close.
(Click on image to enlarge)
The U.S. Treasury puts the closing yield on the 10-year note as of January 6 at 3.55% which is above its record low (0.52% on 8/4/2020). The 2-year note is at 4.24%. See our latest Treasury Snapshot here.
(Click on image to enlarge)
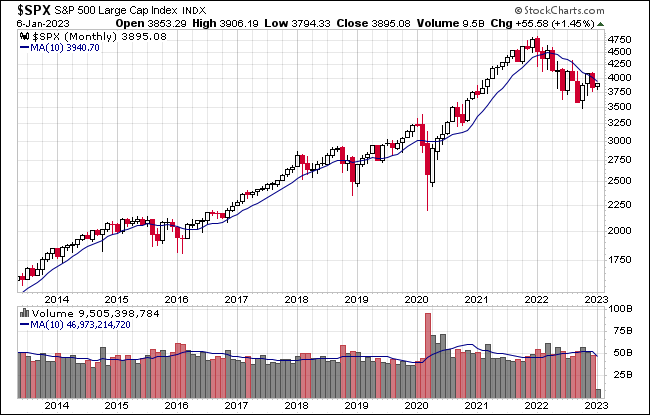
Here's a snapshot of the index going back to 2012.
(Click on image to enlarge)
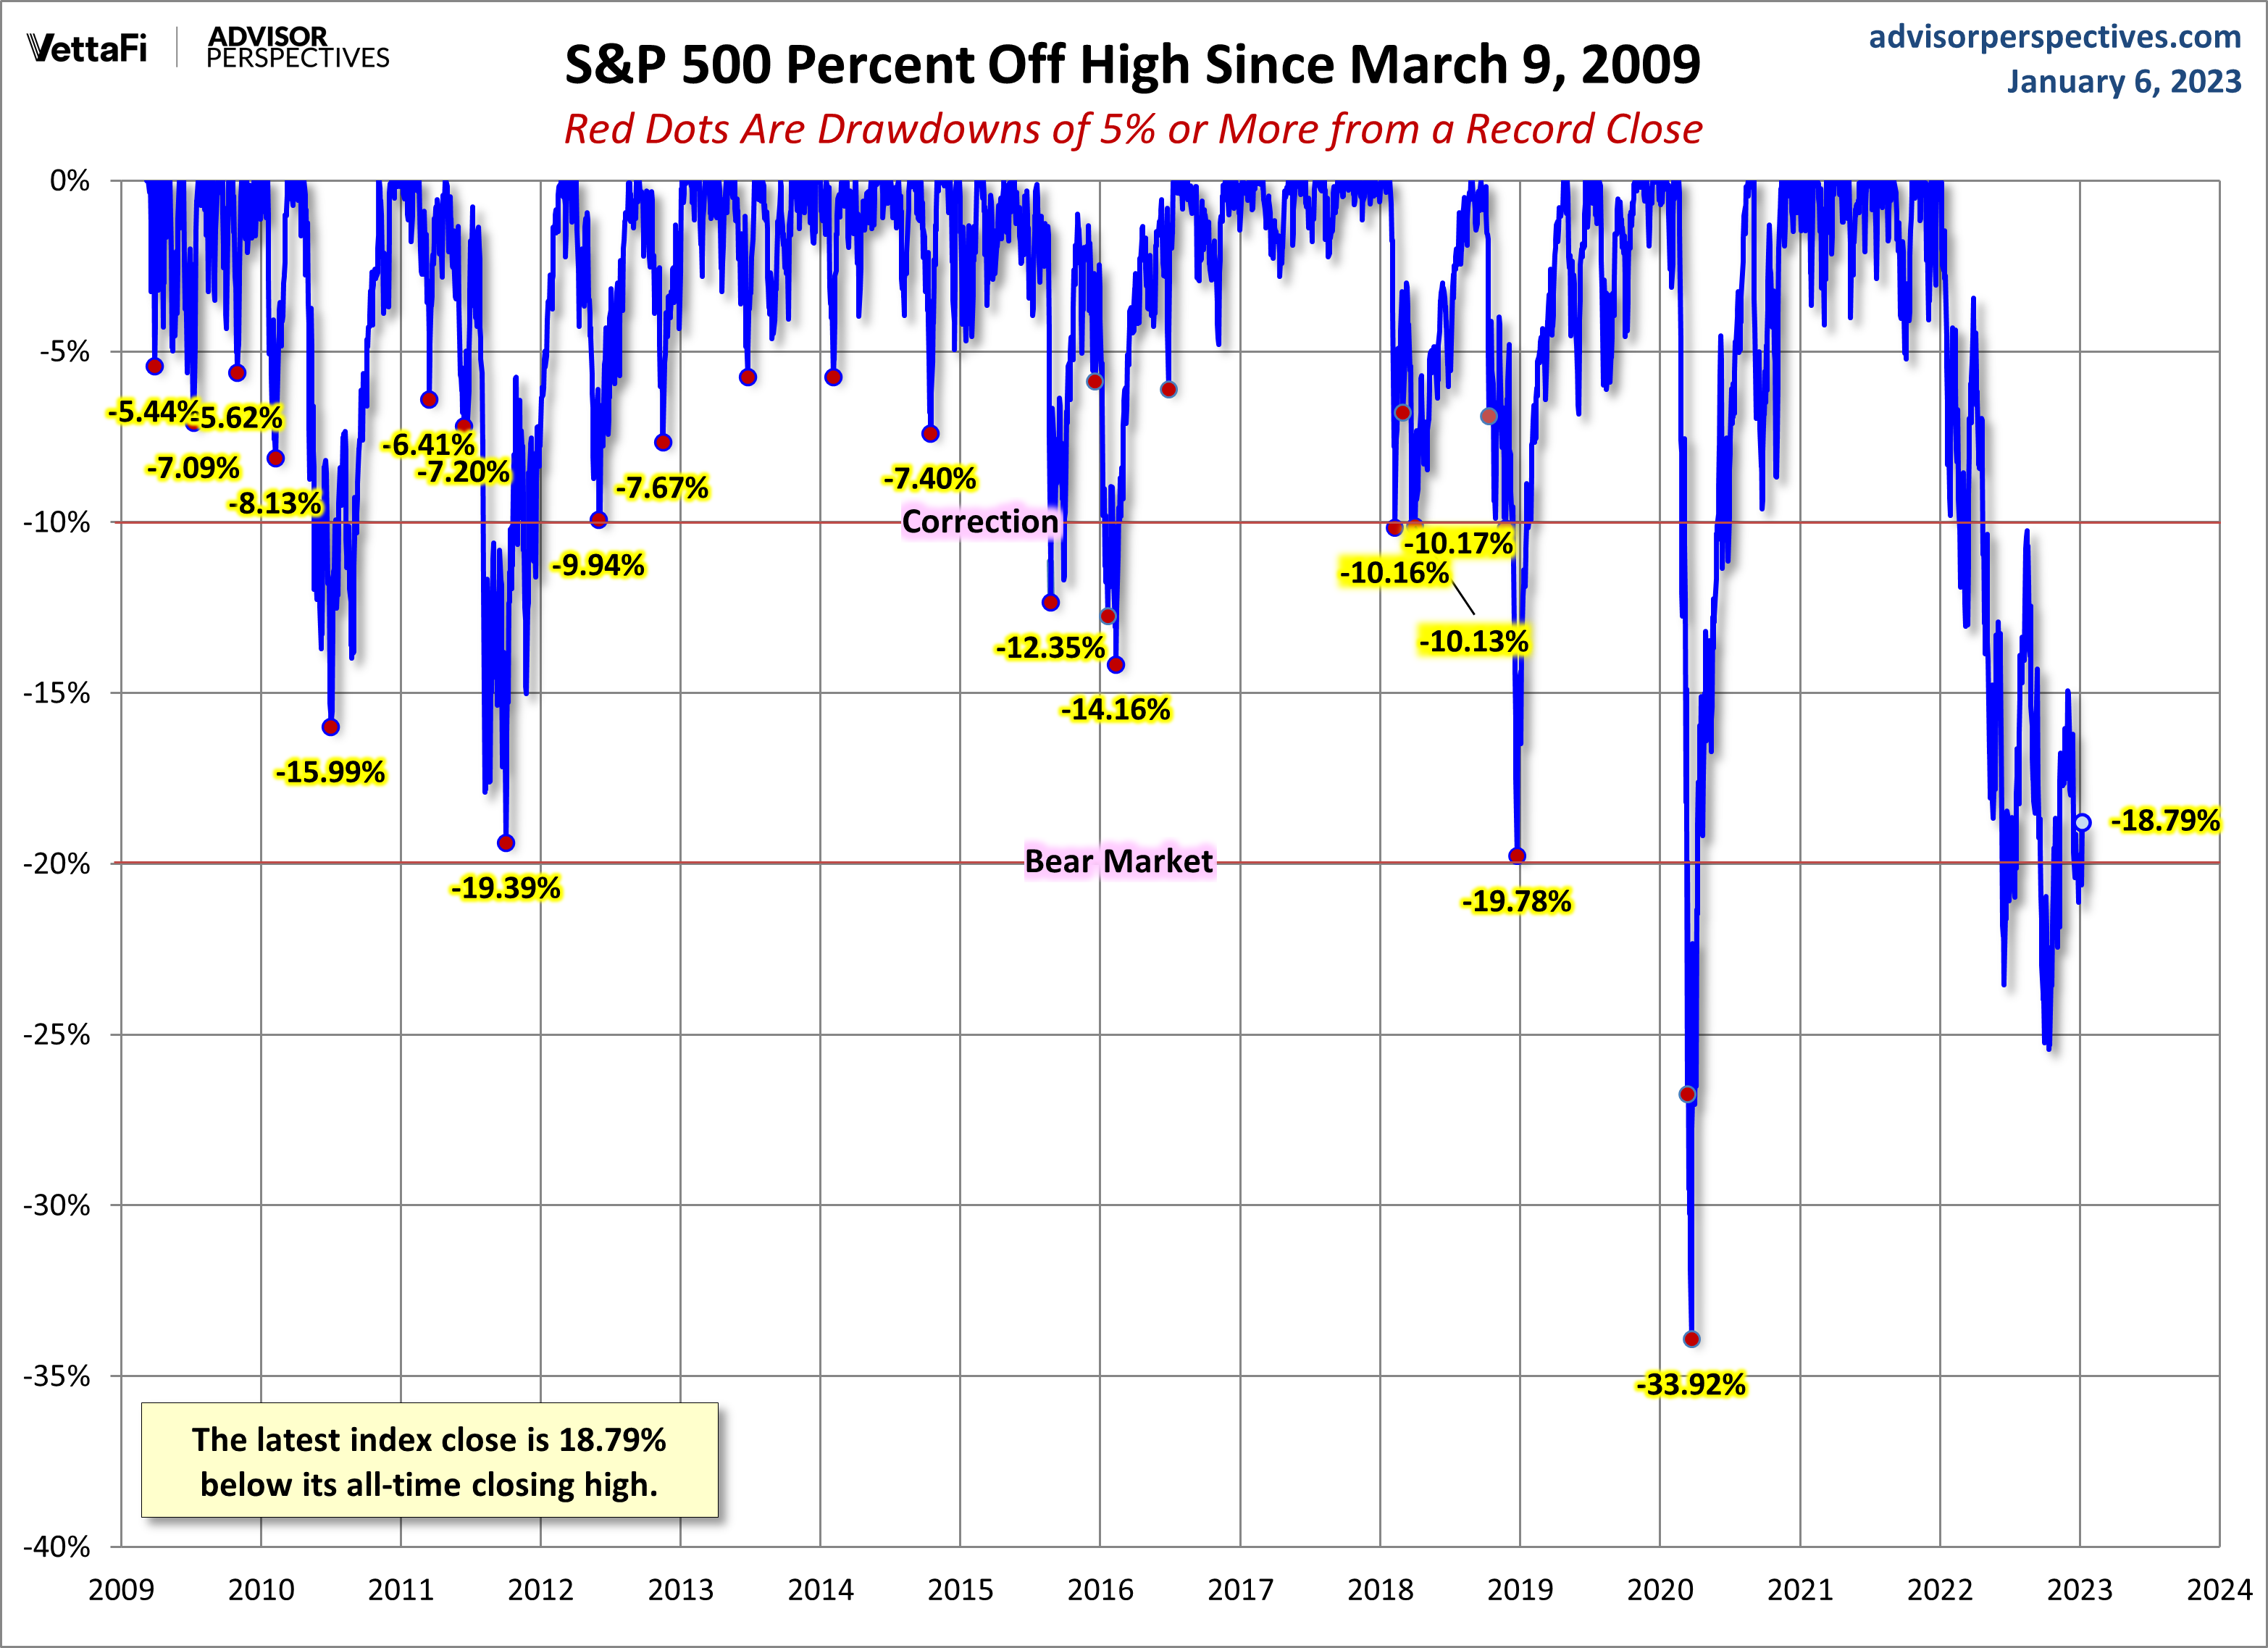
A Perspective on Drawdowns
Here's a snapshot of record highs and selloffs since the 2009 trough. Note the recent selloffs in 2022.
(Click on image to enlarge)
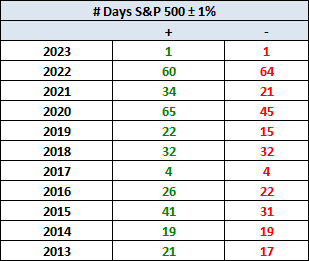
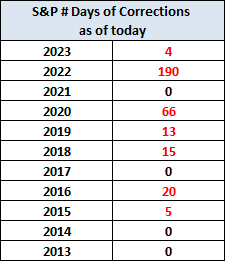
Here's a table with the number of days of a 1% or more change in either direction and the number of days of corrections (down 10% or more from the record high) going back to 2013.
(Click on image to enlarge)
(Click on image to enlarge)
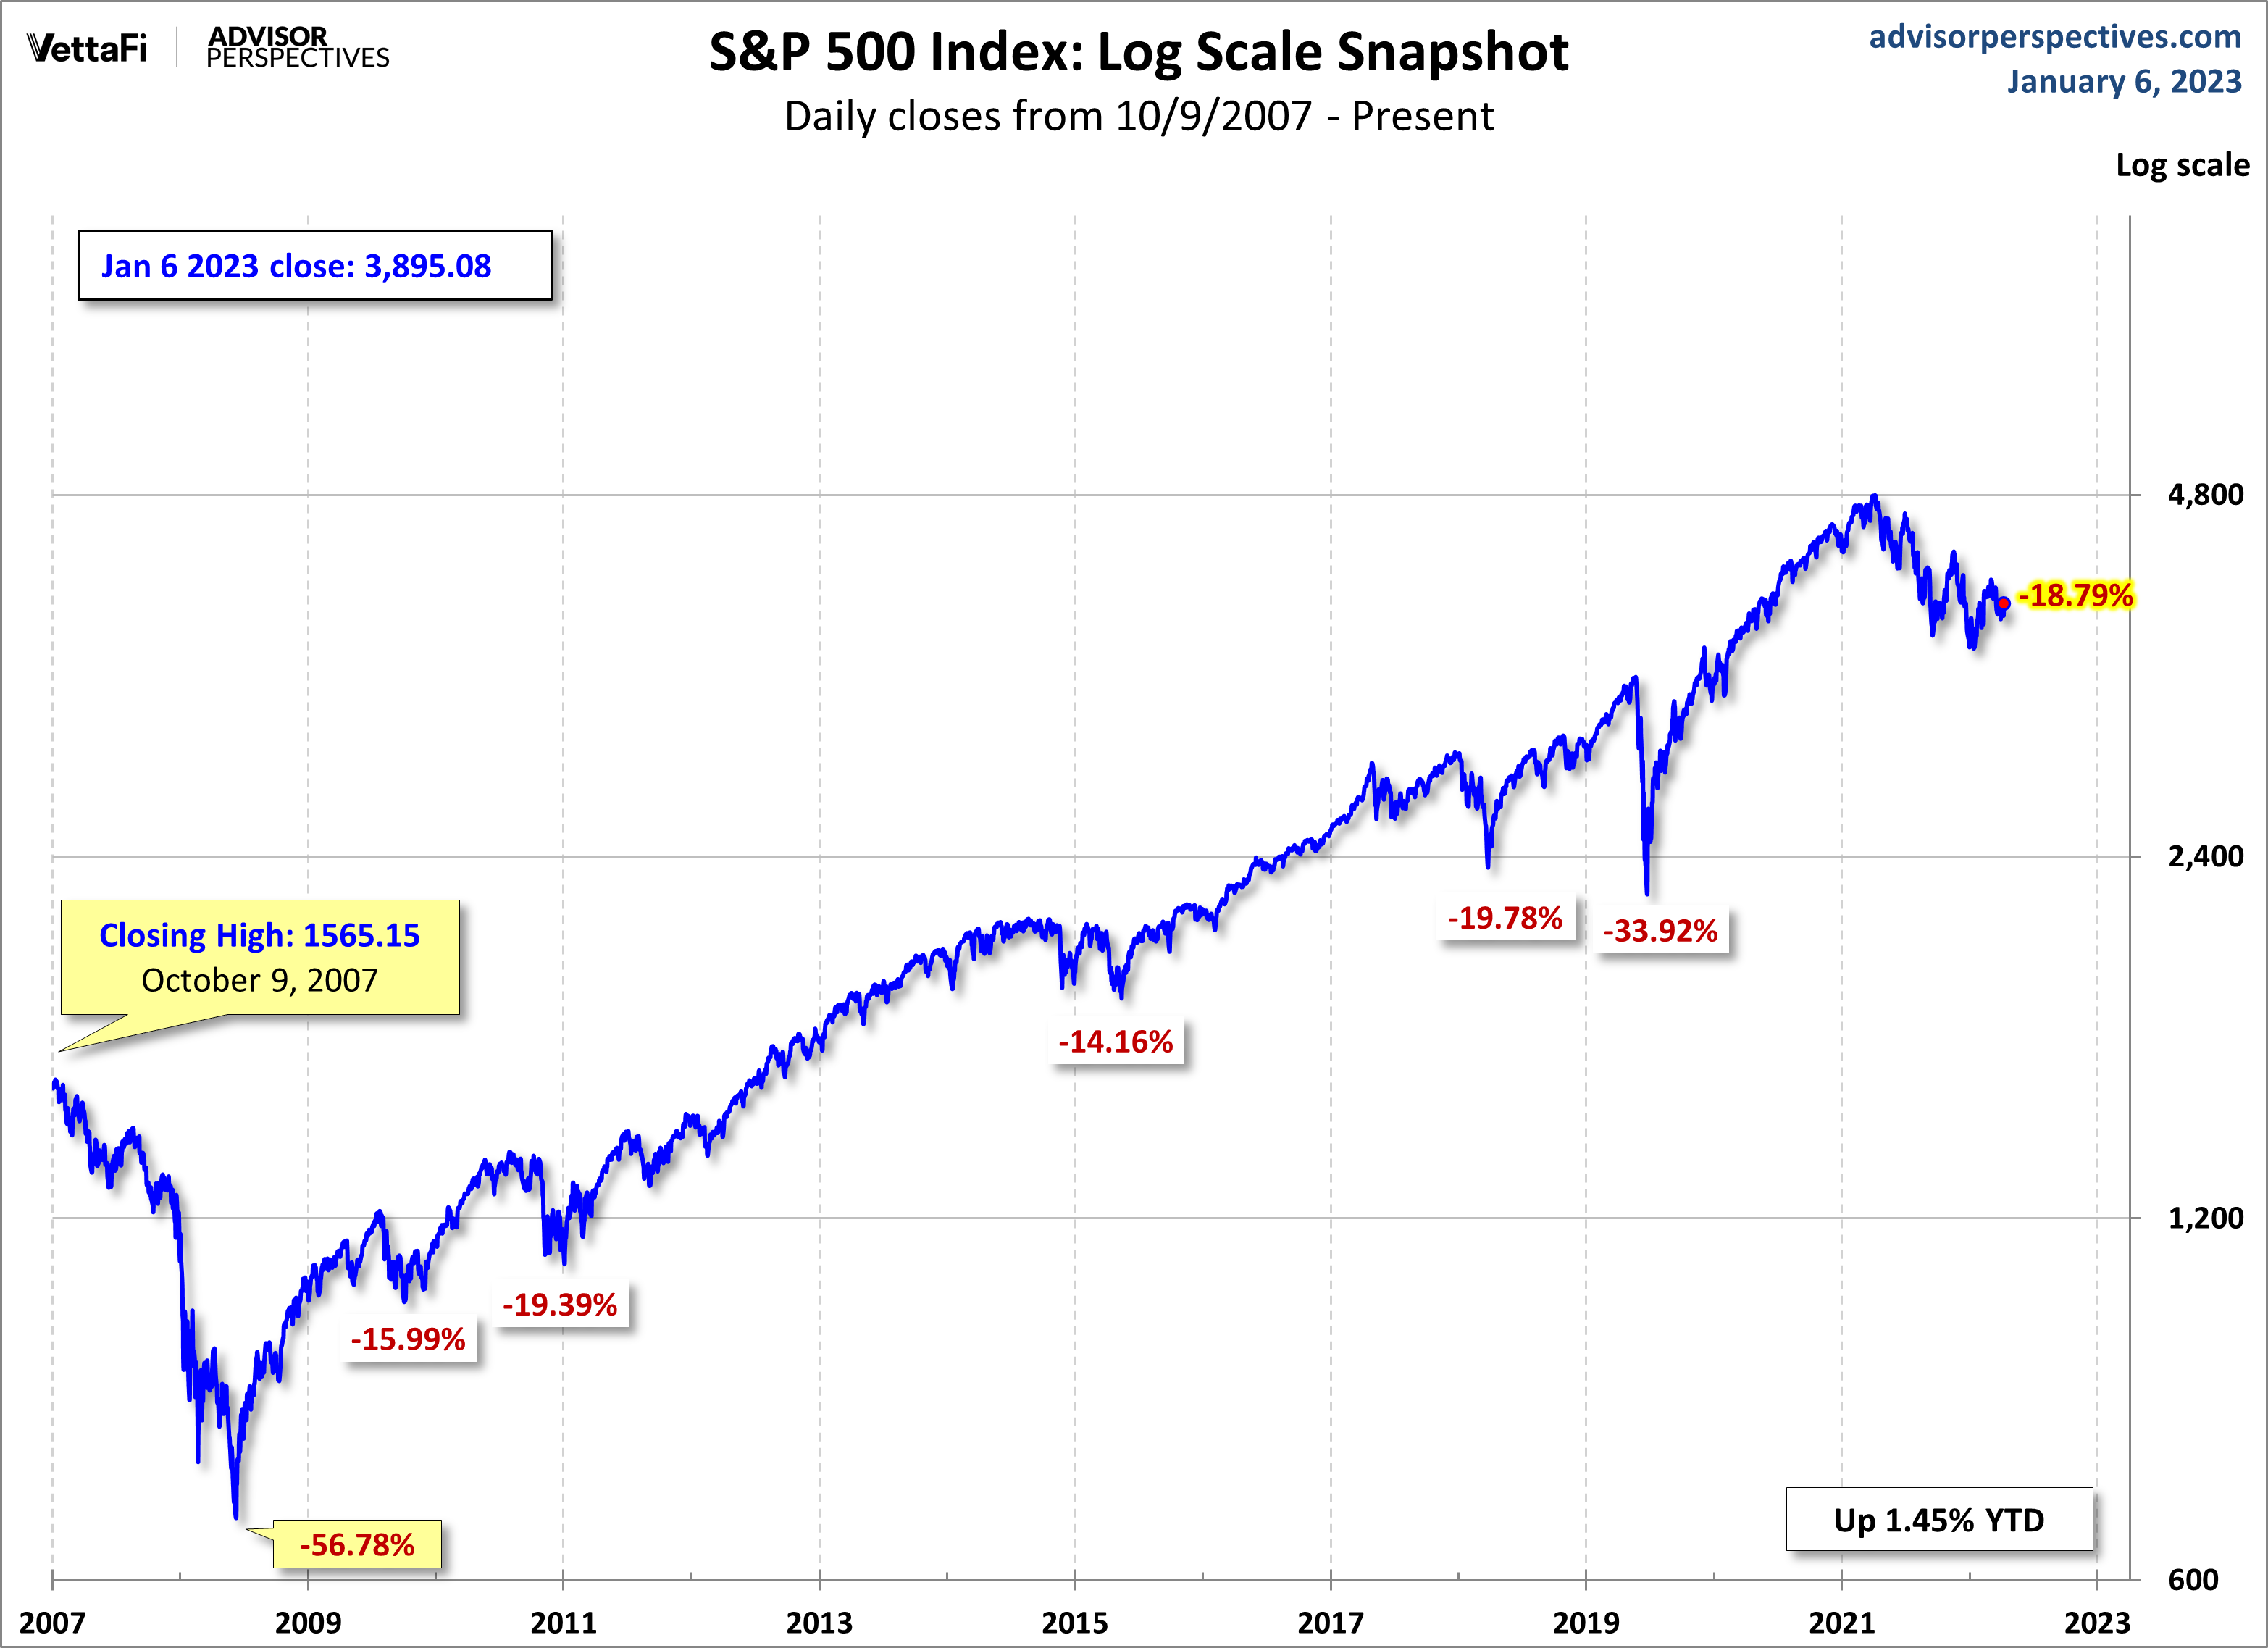
Here is a more conventional log-scale chart with drawdowns highlighted.
(Click on image to enlarge)
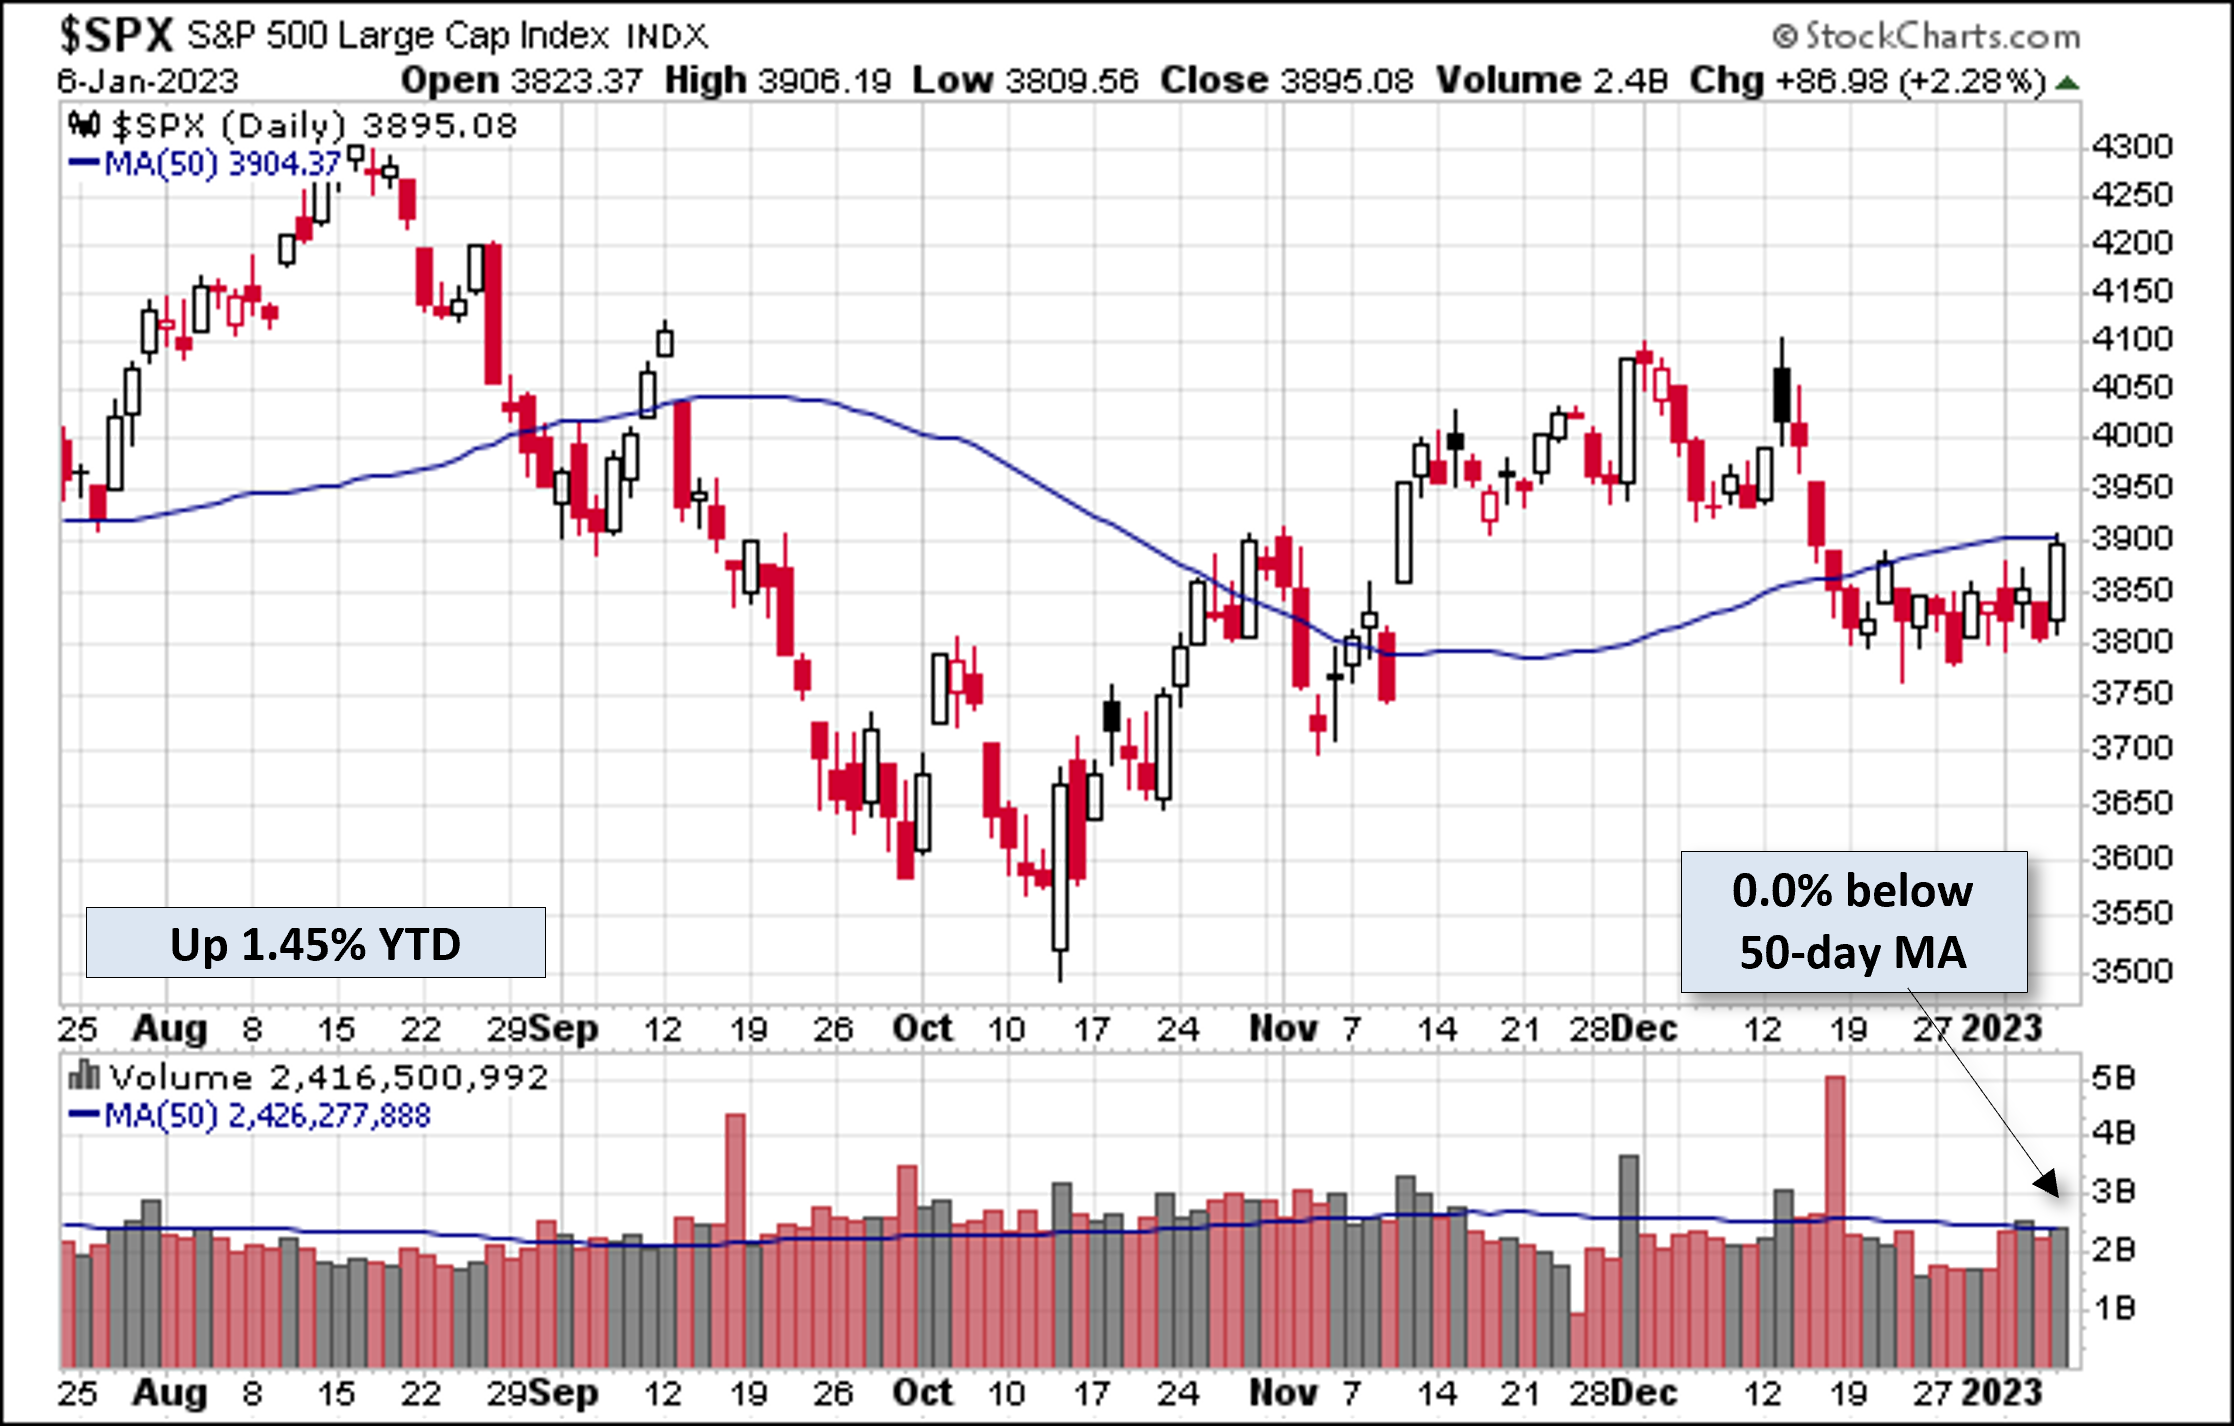
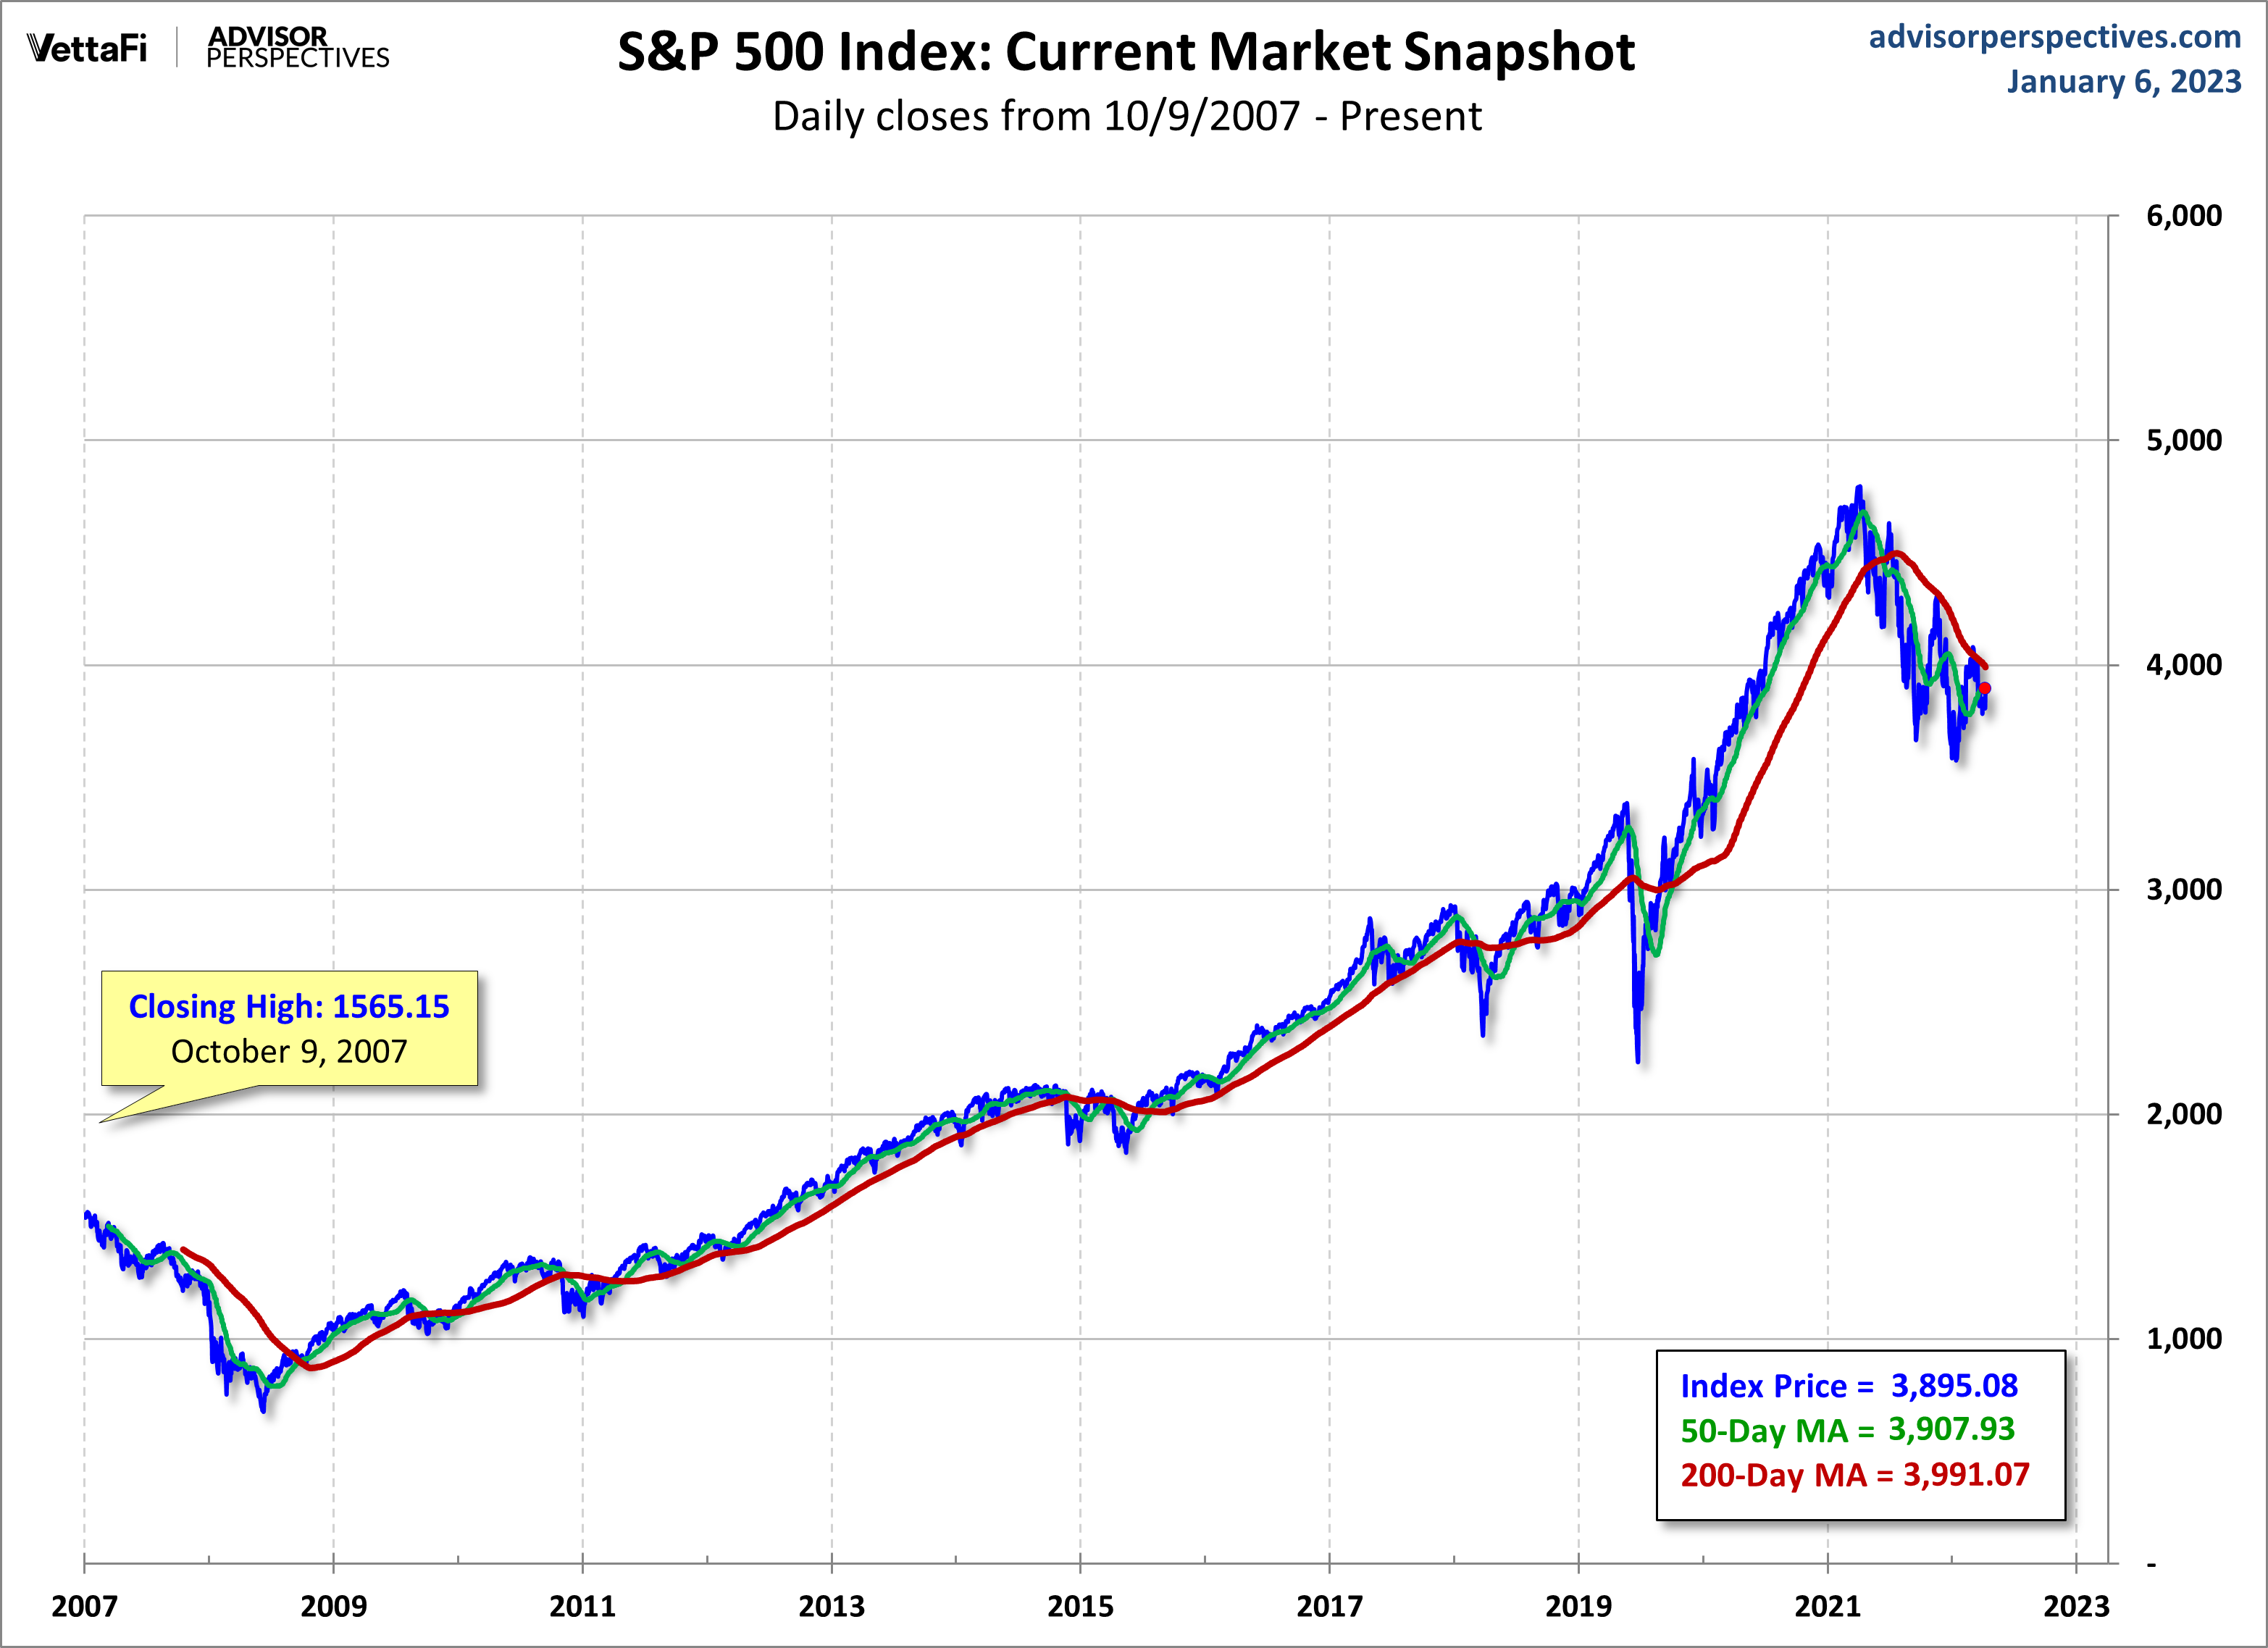
Here is a linear scale version of the same chart with the 50- and 200-day moving averages.
(Click on image to enlarge)
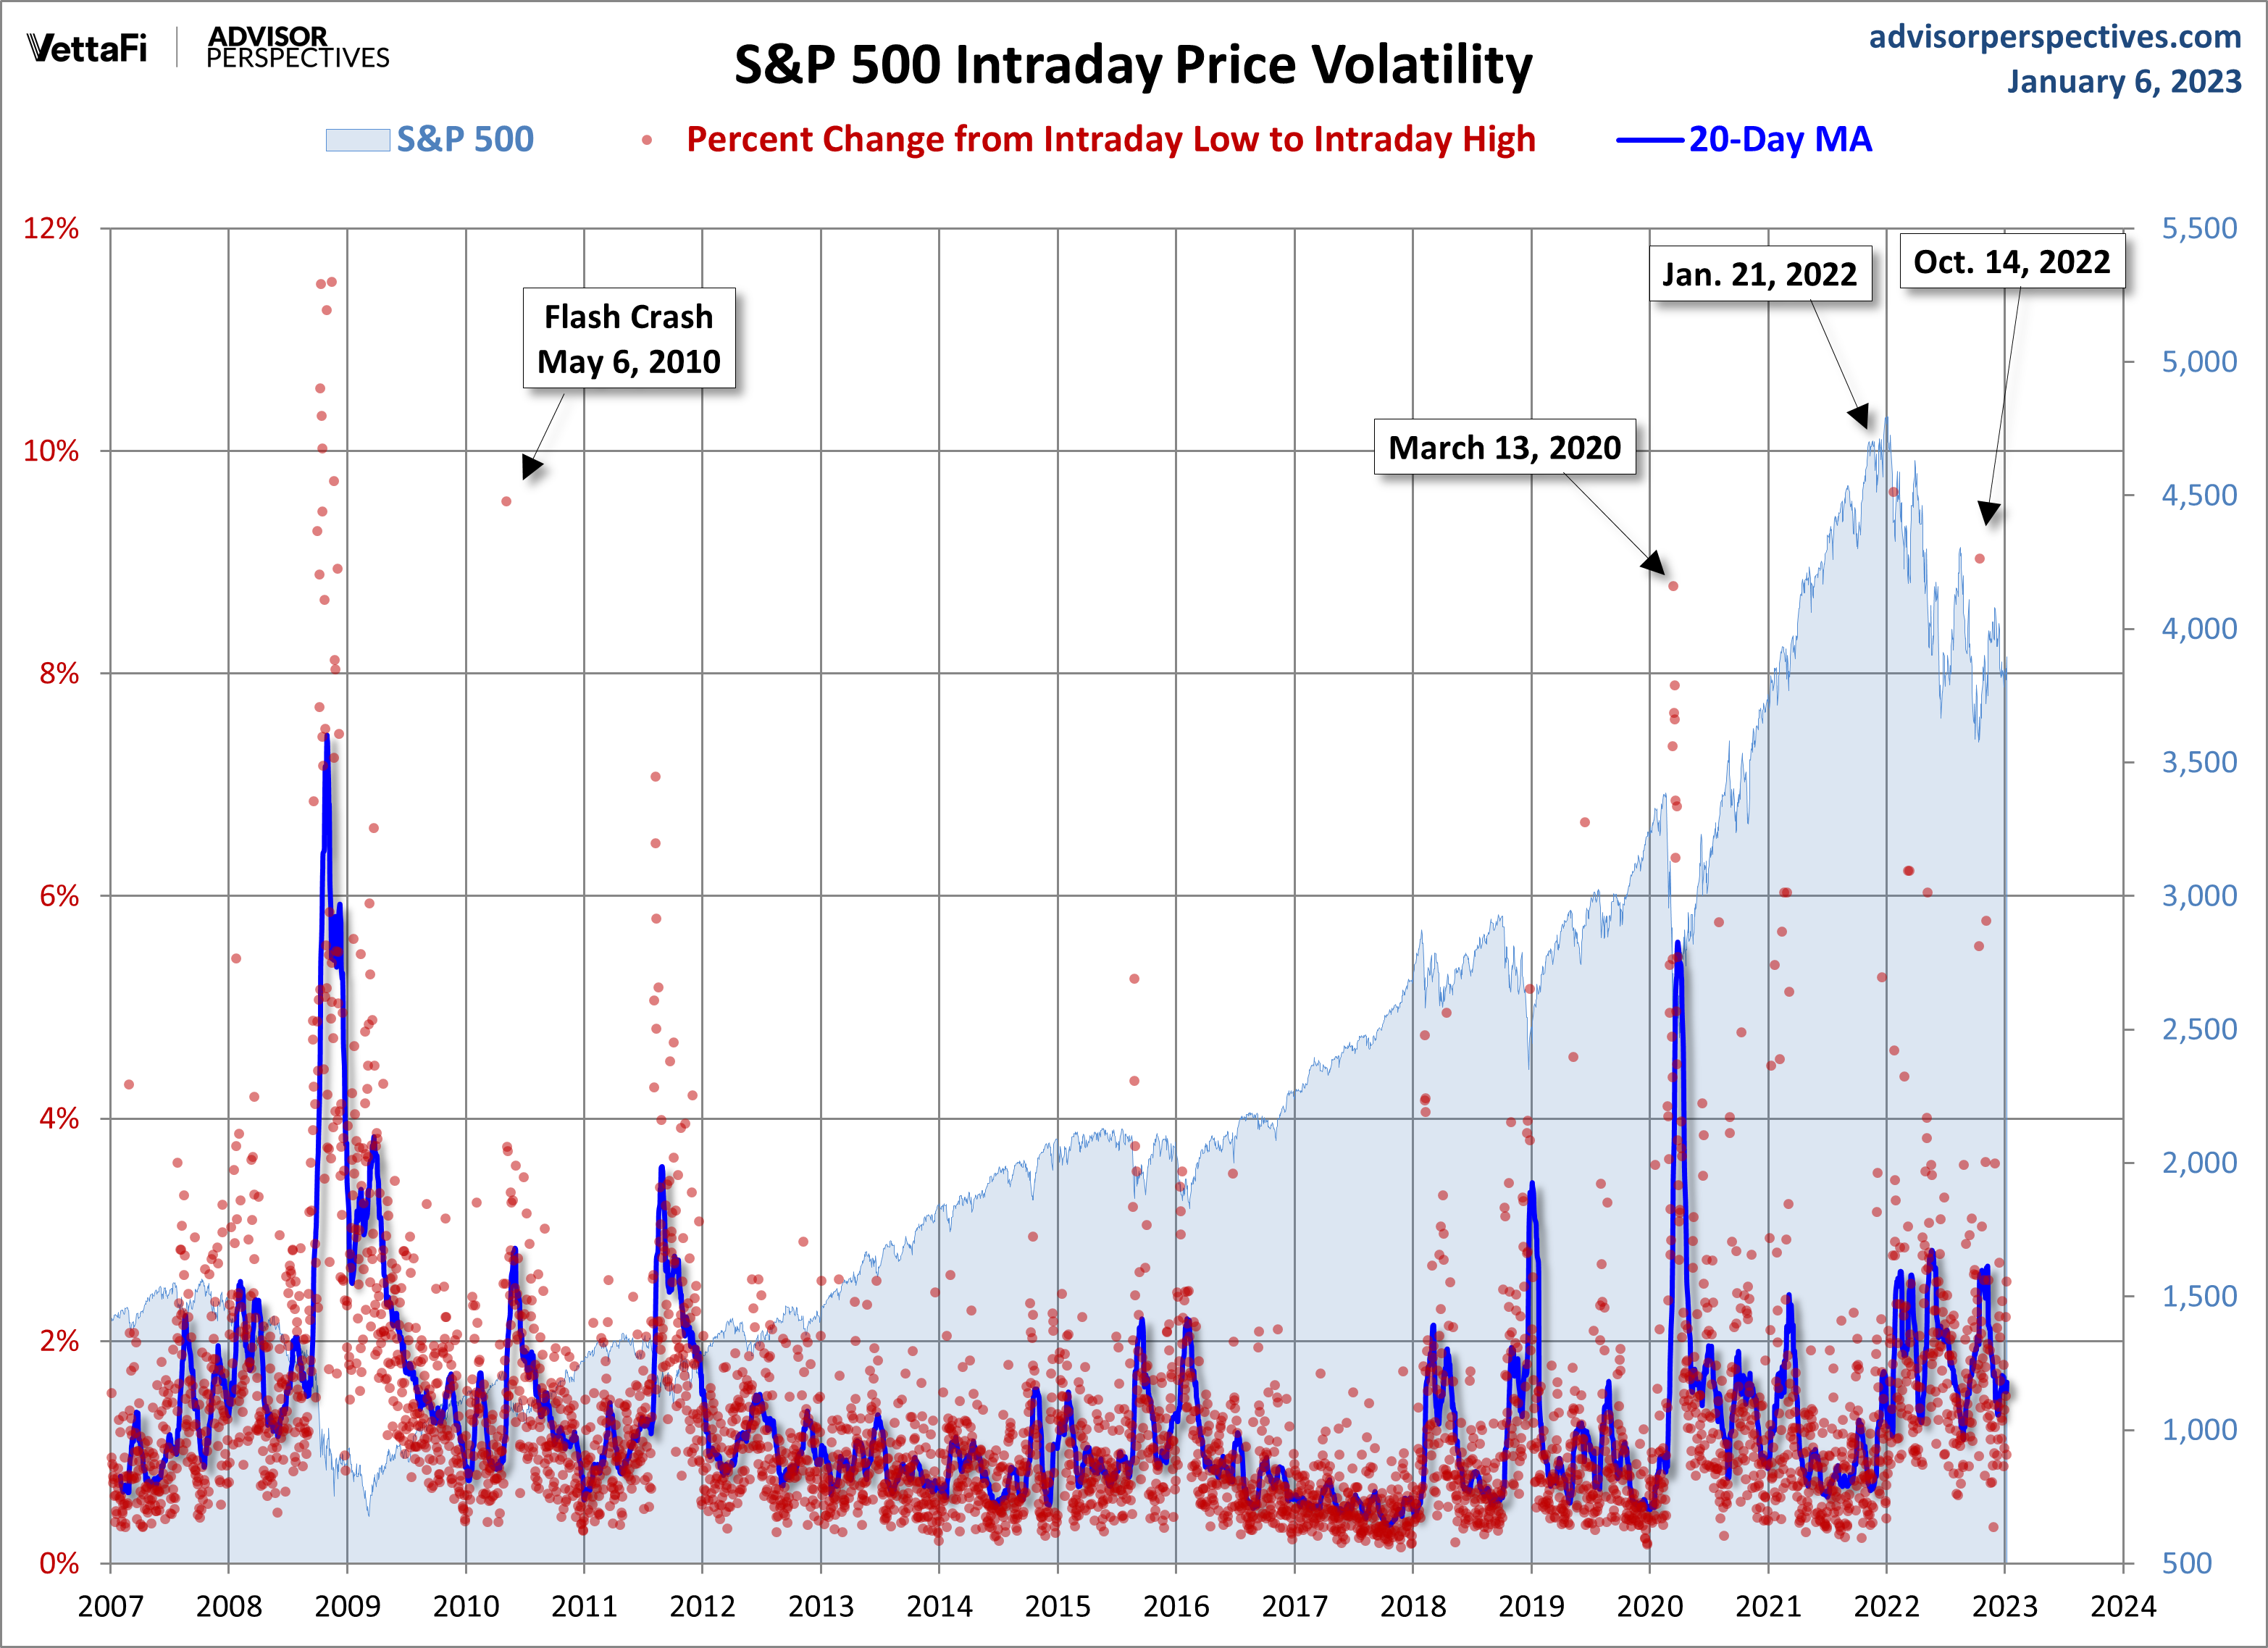
A Perspective on Volatility
For a sense of the correlation between the closing price and intraday volatility, the chart below overlays the S&P 500 since 2007 with the intraday price range. We've also included a 20-day moving average to help identify trends in volatility.
(Click on image to enlarge)
More By This Author:
Treasury Snapshot Friday, Jan. 6Market Cap To GDP - Buffett Valuation Indicator
The Four Totally Bad Bear Recoveries: Where Is Today's Market? Friday, Jan. 6


Comments
Log in or sign up to join the conversation.