
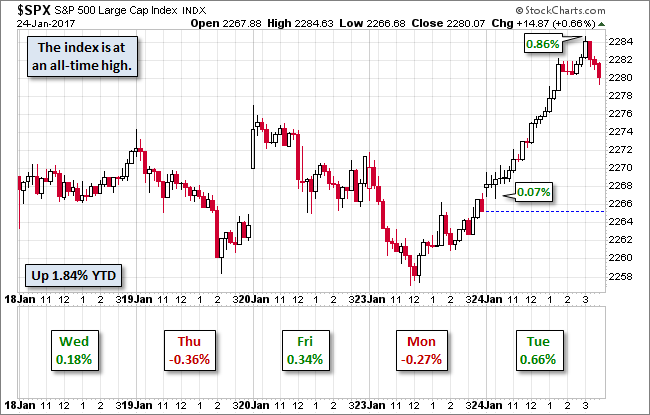
S&P 500 Snapshot: Record Intraday High And Record Close
The S&P 500 continued the upward trend that began early Monday afternoon, moving in a remarkably smooth upward direction to its 0.86% record intraday high. Some profit taking in the final hour trimmed the gain to 0.66%, a new record close. Like the S&P 500, the NASDAQ also hit intraday and closing record highs.
Here is a snapshot of the past five sessions.
The yield on the 10-year Treasury note, which moves inversely to price, closed at 2.47%, up six BPs from the previous close.
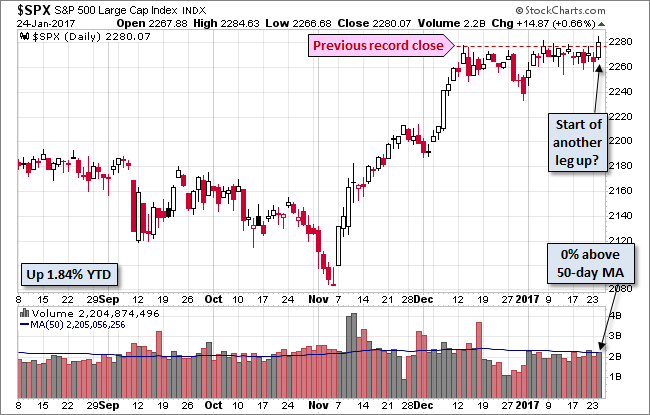
Here is a daily chart of the index. Trading volume on today's rally was unremarkable. Will today's record close prove to be the start of a renewed Trump rally after a relatively flat six weeks? Stay tuned!
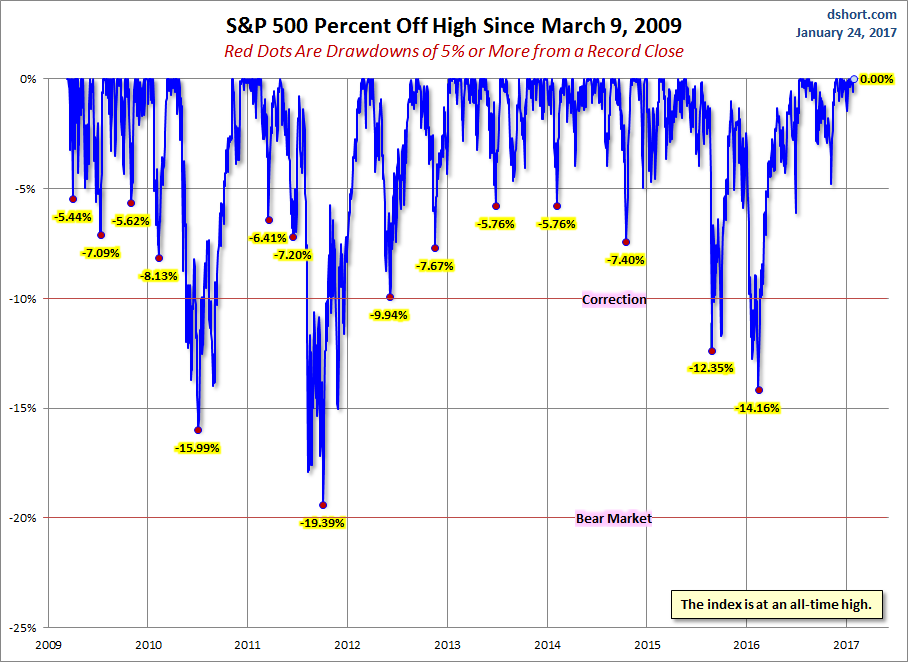
A Perspective on Drawdowns
Here's a snapshot of record highs and selloffs since the 2009 trough.
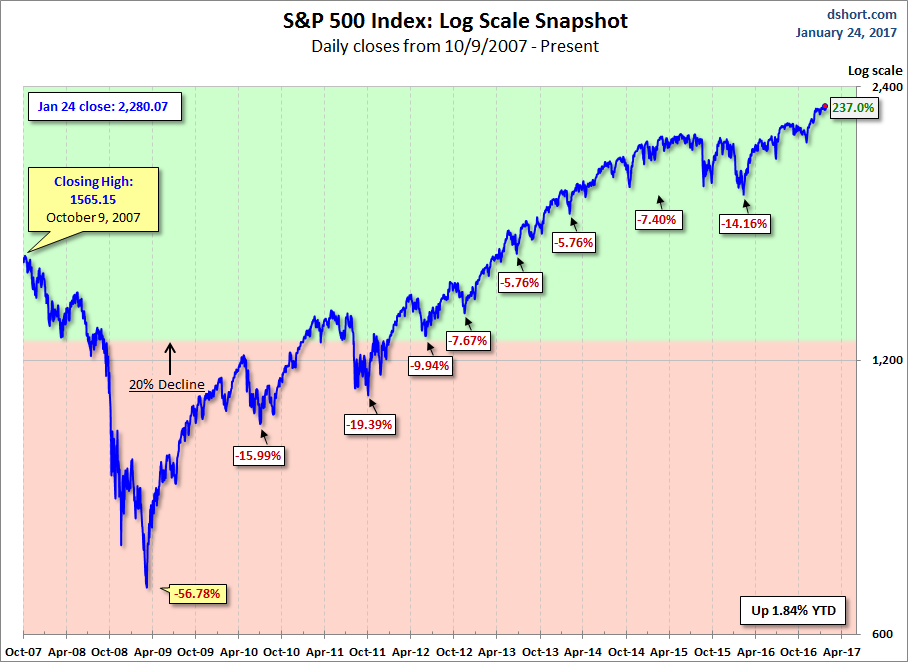
Here is a more conventional log-scale chart with drawdowns highlighted.
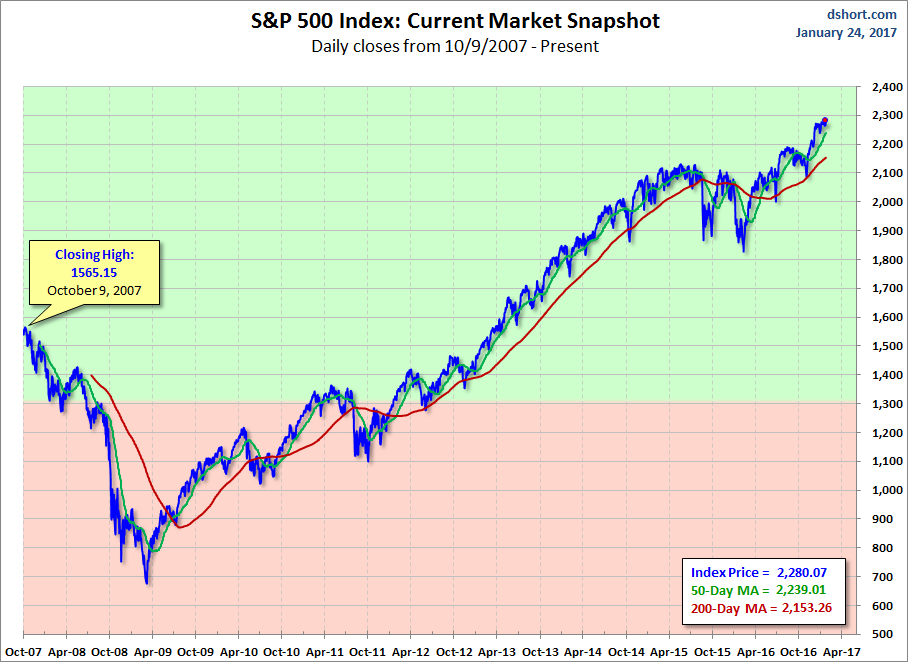
Here is a linear scale version of the same chart with the 50- and 200-day moving averages.
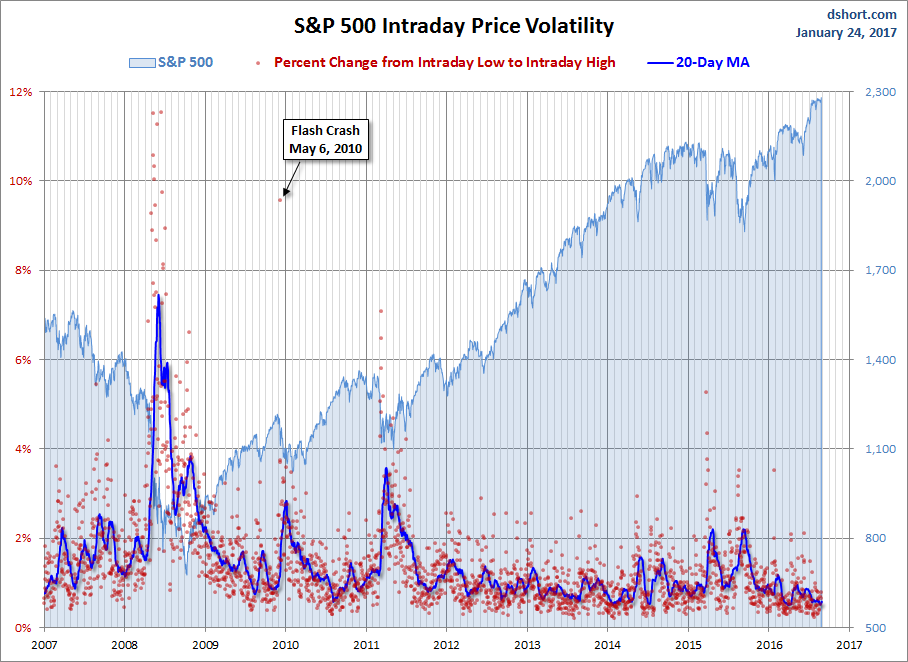
A Perspective on Volatility
For a sense of the correlation between the closing price and intraday volatility, the chart below overlays the S&P 500 since 2007 with the intraday price range. We've also included a 20-day moving average to help identify trends in volatility.
Disclosure: None.


Thanks for sharing