
S&P 500 Snapshot: Monday Sell-off, Worst Close Of 2017
Markets around the globe were in selling mode today, triggered by President Trump's immigration ban, especially in Europe, where the STOXX 600 had lost 1.05% by the close. The S&P 500 plunged at the open and hit its -1.04% intraday low shortly before 11 AM. It then zig-zagged slightly higher until the final 30 minutes, when the closing algorithms trimmed the loss to 0.60%. The Dow dropped below its celebrated 20K benchmark and posted a closely matching 0.61% decline.
Here is a snapshot of the past five sessions in the S&P 500.
(Click on image to enlarge)
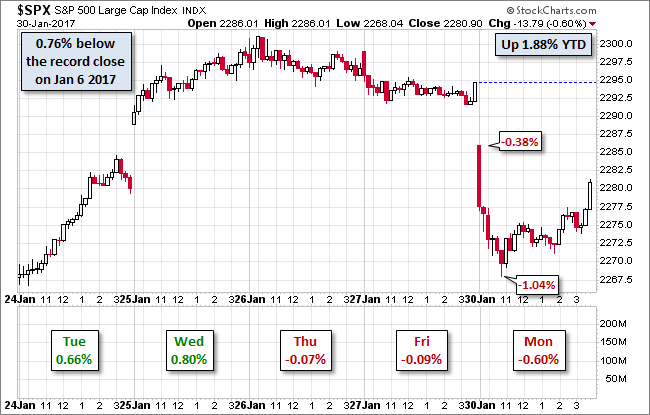
The U.S. Treasury puts the closing yield on the 10-year note at 2.49%, unchanged from the previous close.
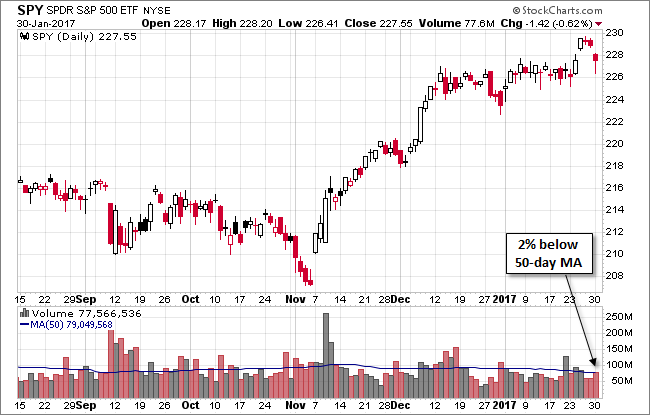
Here is a daily chart of the SPY ETF, which gives a better sense of investor participation in today's selling. Volume was unremarkable.
(Click on image to enlarge)
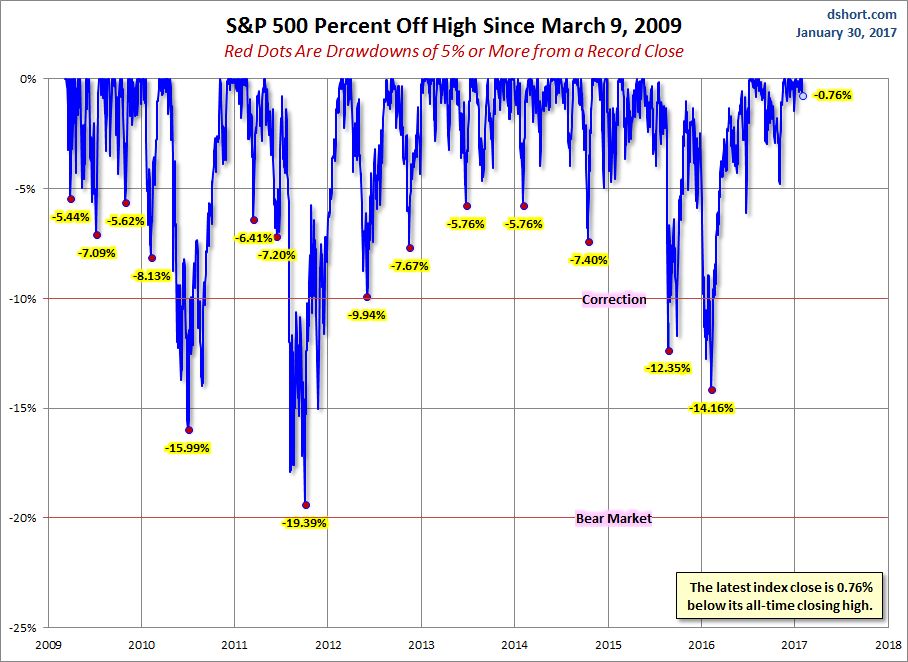
A Perspective on Drawdowns
Here's a snapshot of record highs and selloffs since the 2009 trough.
(Click on image to enlarge)
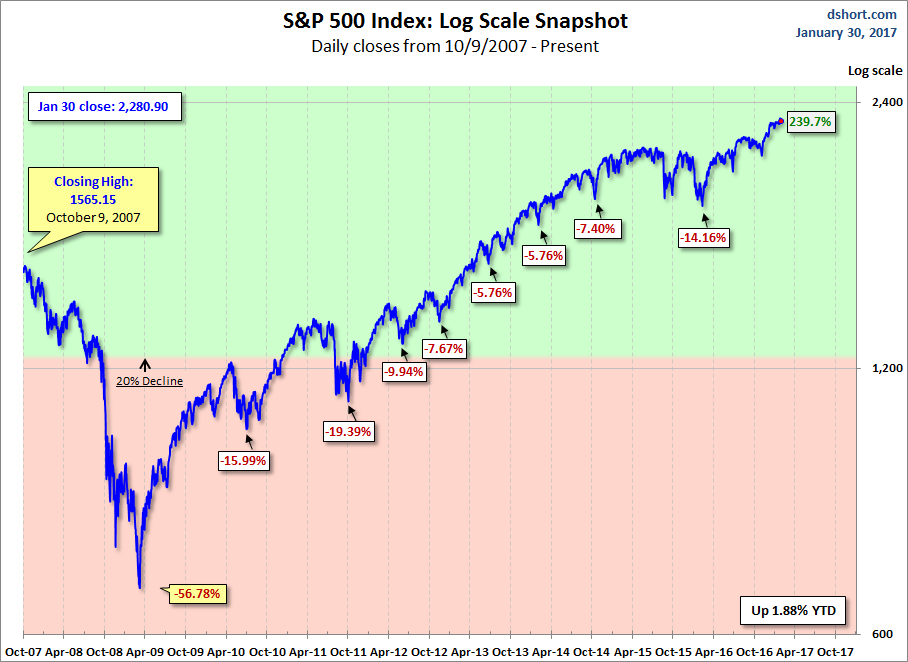
Here is a more conventional log-scale chart with drawdowns highlighted.
(Click on image to enlarge)
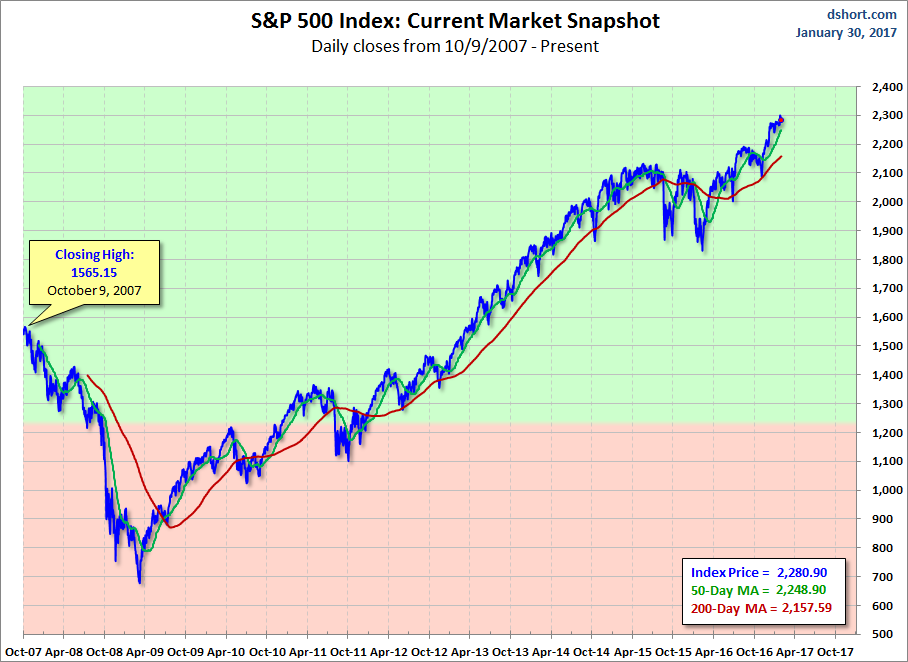
Here is a linear scale version of the same chart with the 50- and 200-day moving averages.
(Click on image to enlarge)
A Perspective on Volatility
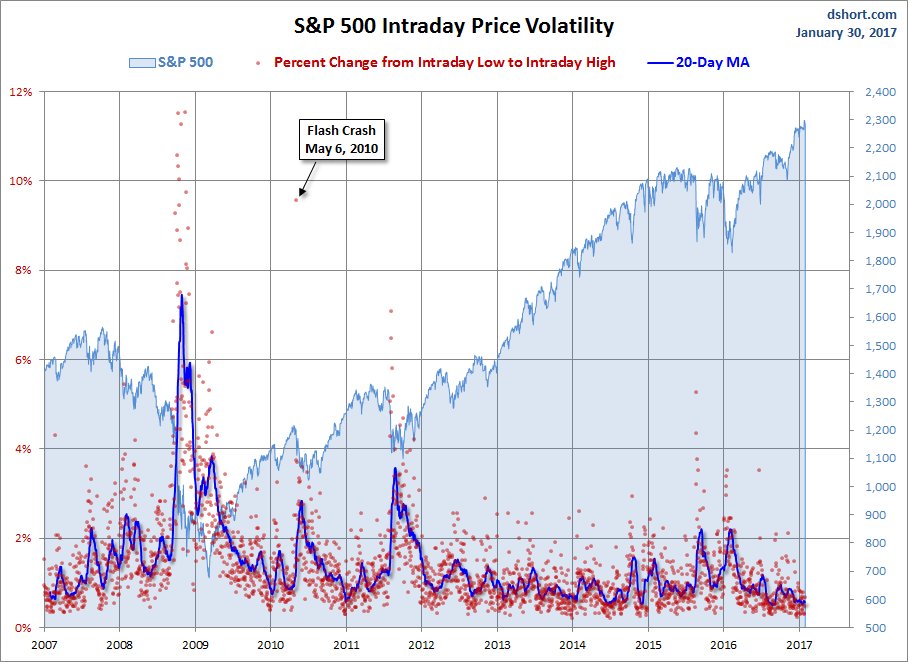
For a sense of the correlation between the closing price and intraday volatility, the chart below overlays the S&P 500 since 2007 with the intraday price range. We've also included a 20-day moving average to help identify trends in volatility.
(Click on image to enlarge)
Disclosure: None.


Thanks sir for your information