
S&P 500 Snapshot: Friday Doldrums, Treasury Selloff Accelerates
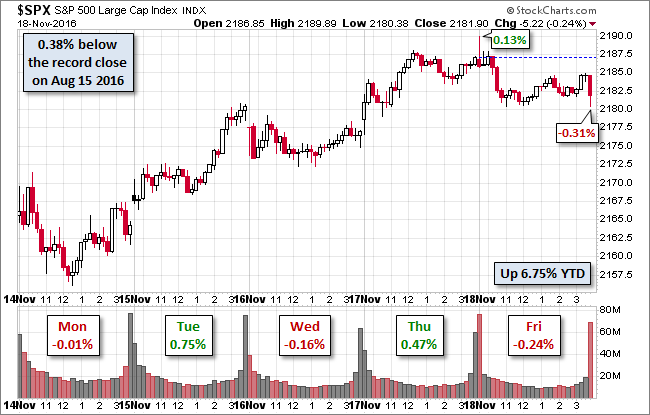
The S&P 500 spent the week alternating between daily wins (Tuesday & Thursday) and losses (Monday Wednesday Friday), with the two wins trumping (pun intended) the three losses. Despite today's modest -0.24% close, the index finished the session with a 0.81% weekly gain.
More dramatic was the acceleration of the treasury selloff. The yield on the 10-year note hit an intraday high of 2.36% the highest since early December of last year. It closed the session at 2.34%, up 19 BPs from the previous weekly close, and up 55 BPs over the past two weeks. Freddie Mac puts the latest weekly average of the 30-year fixed rate mortgage at 3.94%, about half a percent higher than where it was a month earlier.
Here is a snapshot of the past five sessions.
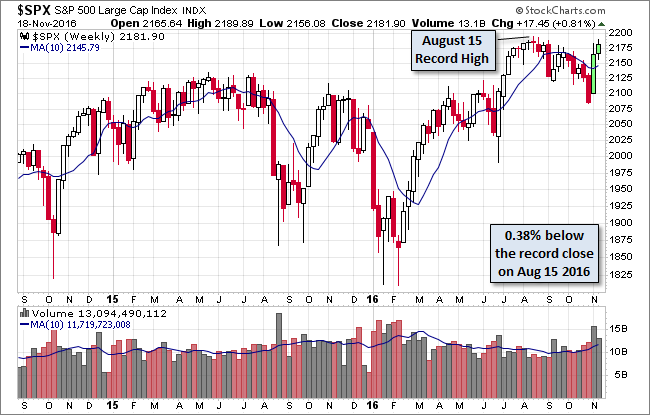
Here's a weekly chart of S&P 500 with the two-week Trump rally highlighted. The latest weekly gain of 0.81% is well off the 3.80% surge the previous week.
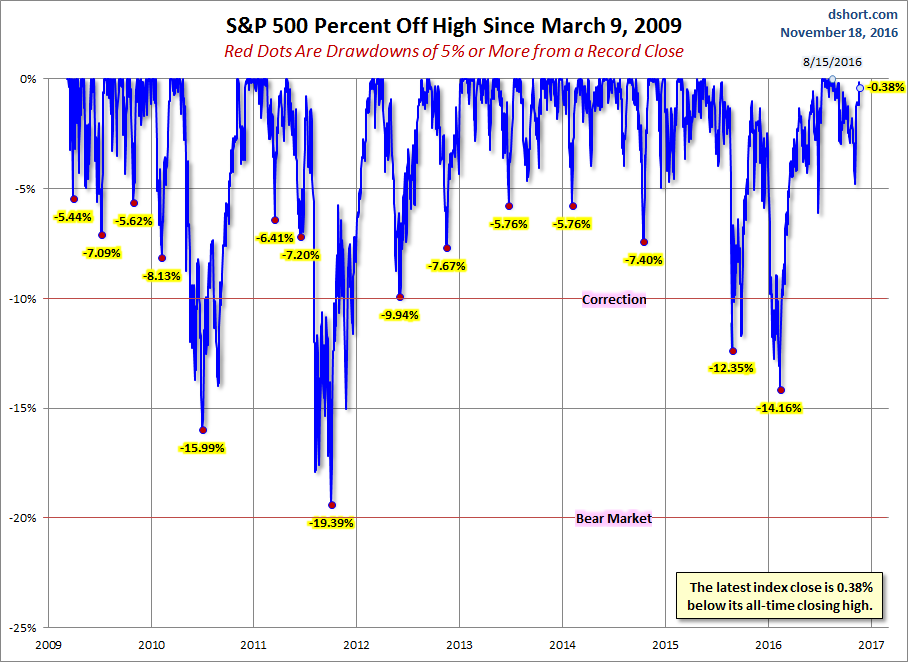
A Perspective on Drawdowns
Here's a snapshot of selloffs since the 2009 trough.
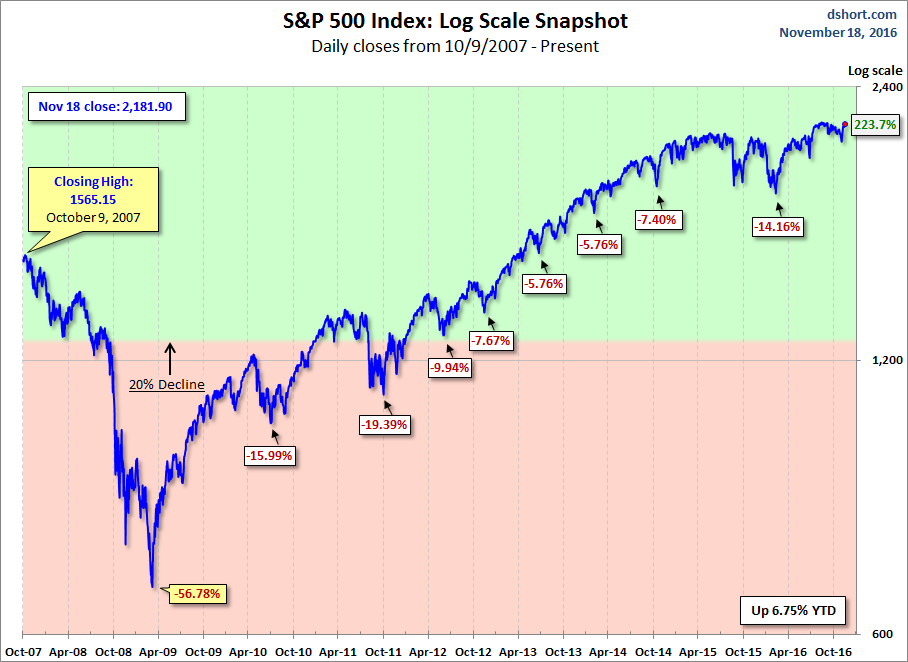
Here is a more conventional log-scale chart with drawdowns highlighted.
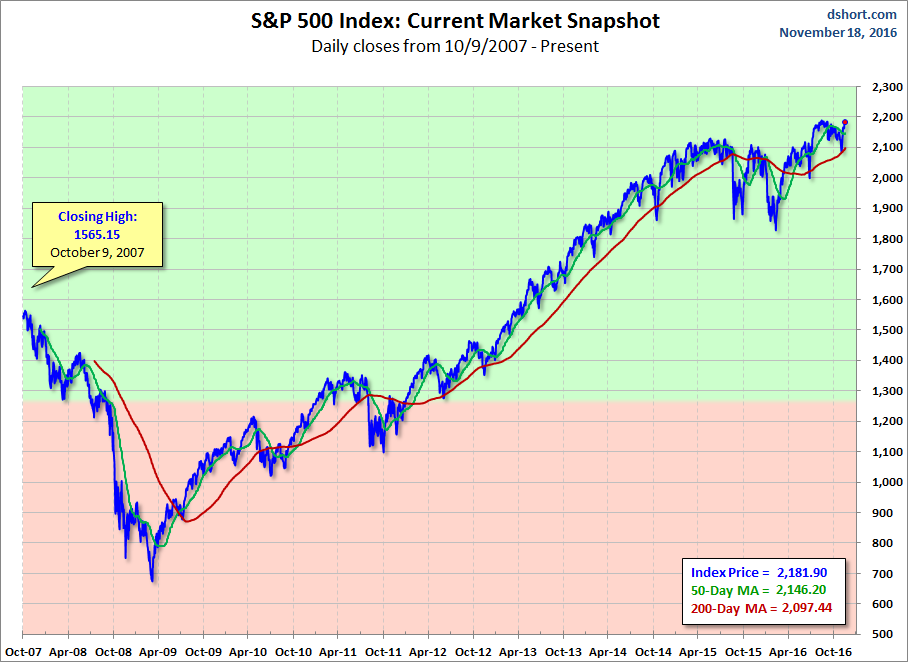
Here is a linear scale version of the same chart with the 50- and 200-day moving averages.
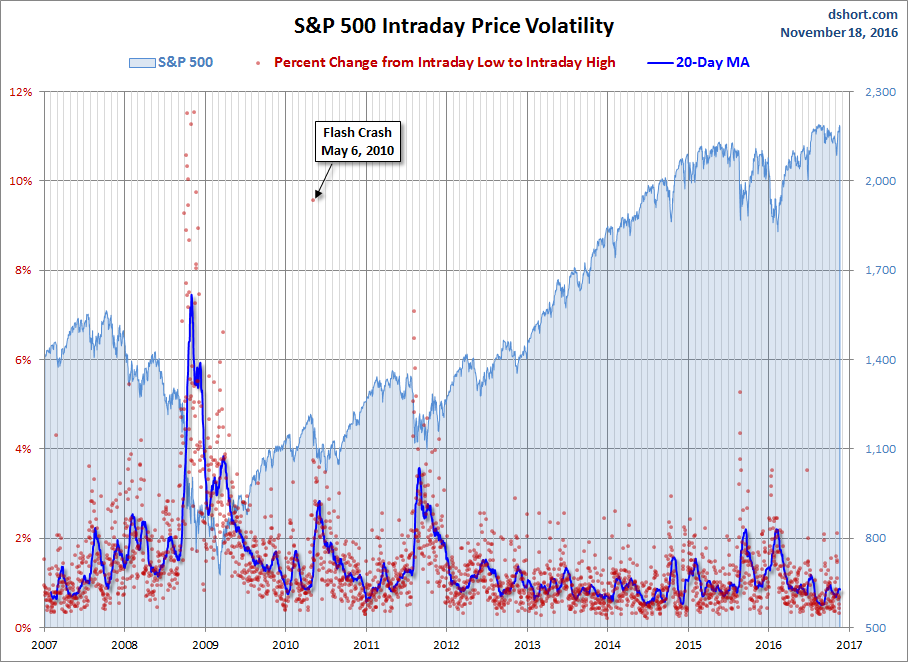
A Perspective on Volatility
For a sense of the correlation between the closing price and intraday volatility, the chart below overlays the S&P 500 since 2007 with the intraday price range. We've also included a 20-day moving average to help identify trends in volatility.
Disclosure: None.


thanks for sharing