
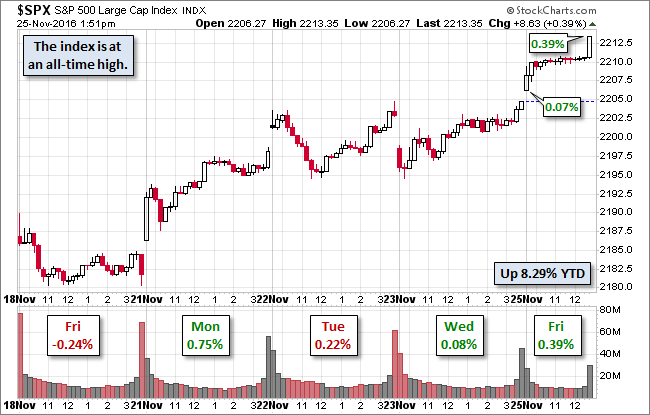
S&P 500 Snapshot: Fourth Consecutive Record Close
The S&P 500 logged its fourth consecutive record close in the post-Thanksgiving shortened session. The index rose during the opening 30 minutes and then traded sideways to the final 15 minutes when it rose again to close at its 0.39% intraday high.
The yield on the 10-year note closed at 2.37%, the highest close since July 14 of last year.
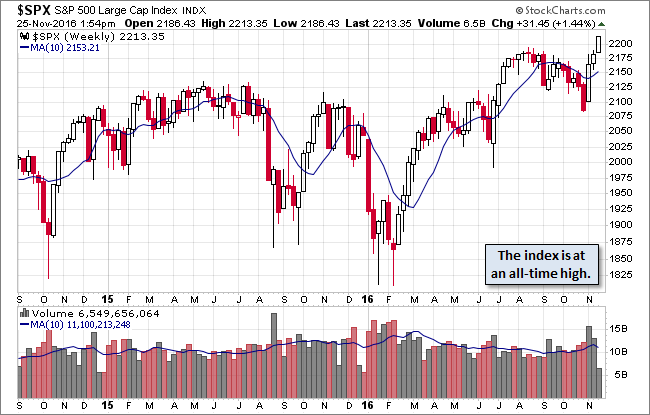
Here's a weekly chart of the S&P 500, which rose 1.44% over Thanksgiving week, its third consecutive weekly gain.
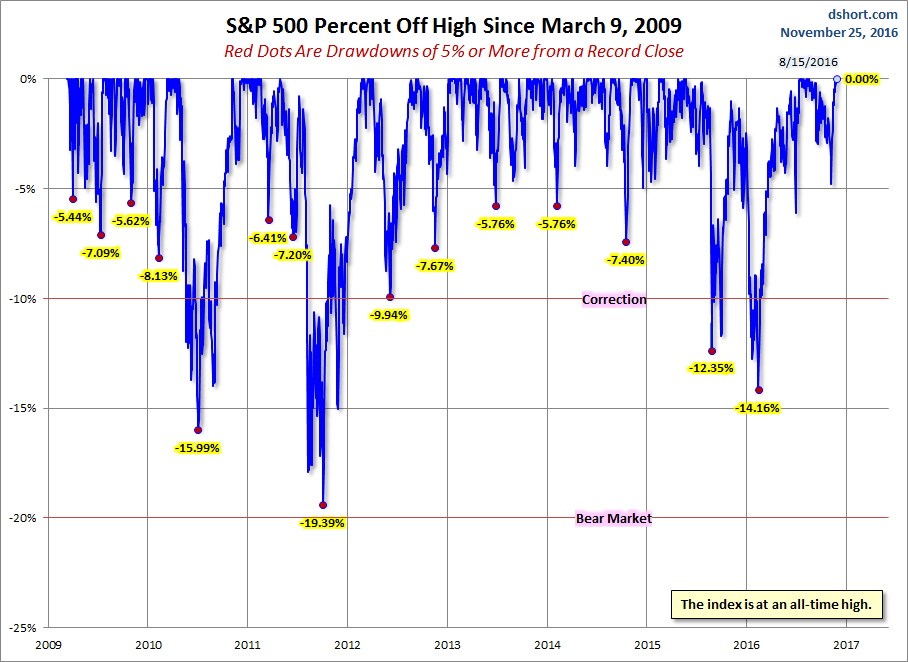
A Perspective on Drawdowns
Here's a snapshot of selloffs since the 2009 trough.
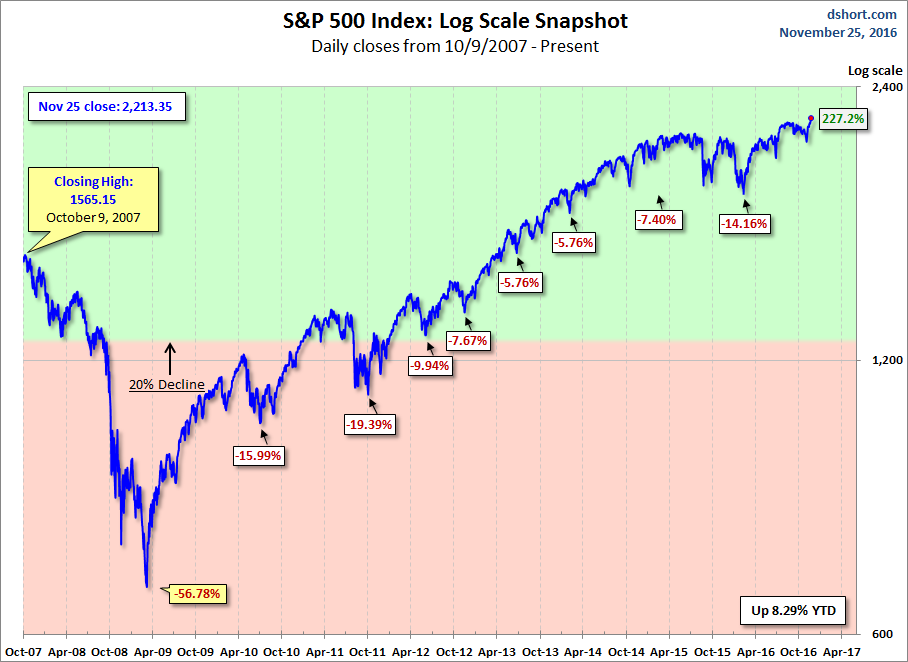
Here is a more conventional log-scale chart with drawdowns highlighted.
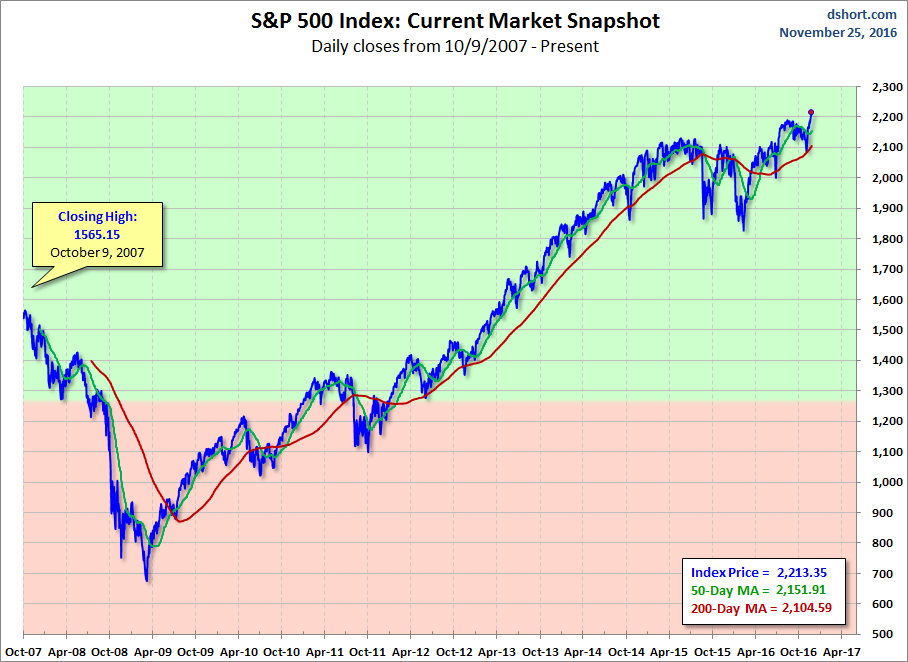
Here is a linear scale version of the same chart with the 50- and 200-day moving averages.
A Perspective on Volatility
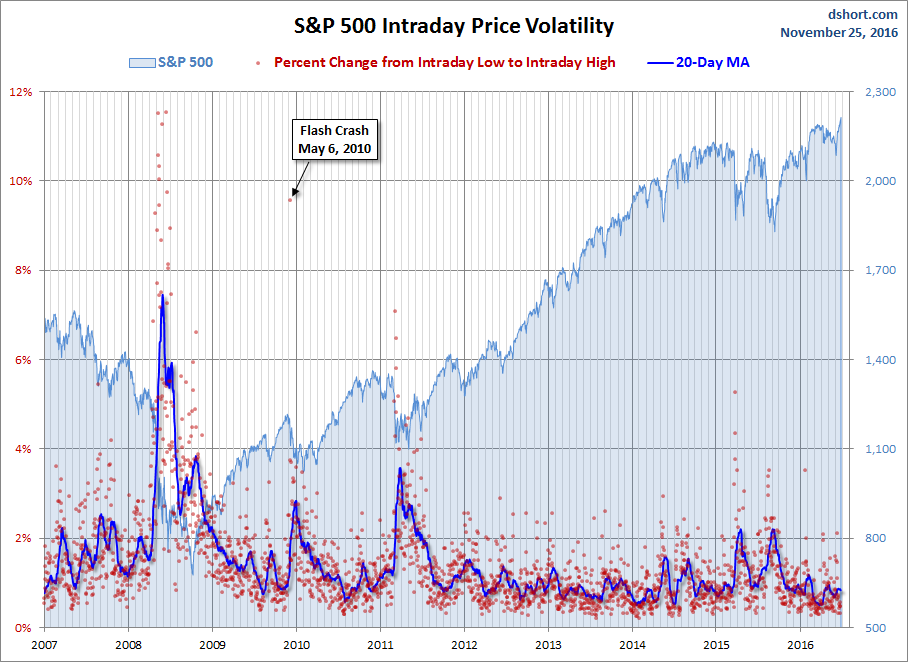
For a sense of the correlation between the closing price and intraday volatility, the chart below overlays the S&P 500 since 2007 with the intraday price range. We've also included a 20-day moving average to help identify trends in volatility.
Disclosure: None.


thanks and merry christmas