
S&P 500 Snapshot: Flat Finish, But The Treasury Sell-off Continues
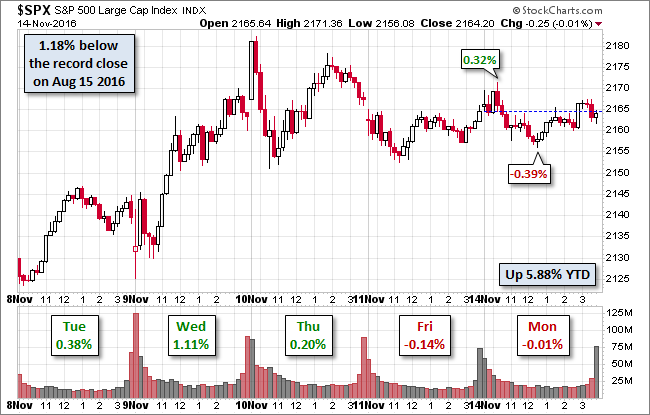
The S&P 500 hit its 0.32% intraday high early in the session and then sold off to its -0.39% lunch-hour low. An afternoon struggle back into the fractional green lost traction in in the final minutes, and the index finished the day flat (technically a miniscule loss of 0.01%).
More dramatic today was the resumed selloff in treasuries after the Veterans Day holiday. The yield on the 10-year note closed the session at 2.23%, up 8 BPs from the Thursday close and 86 BPs above its July closing low. Today's closing yield was the highest since January 5th.
Here is a snapshot of the past five sessions.
(Click on image to enlarge)
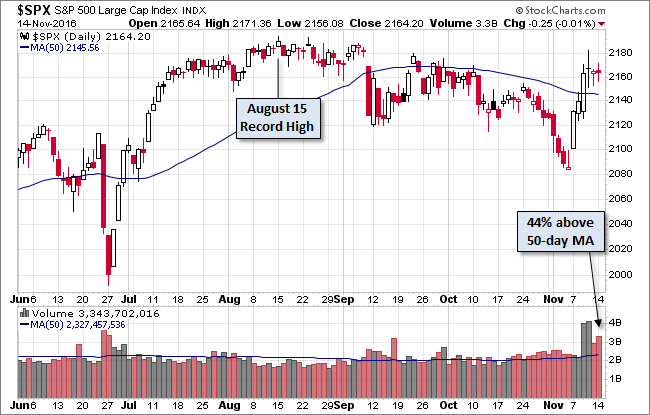
Here's a daily chart of the index. Today's unremarkable trading range and flat finish came on high trading volume.
(Click on image to enlarge)
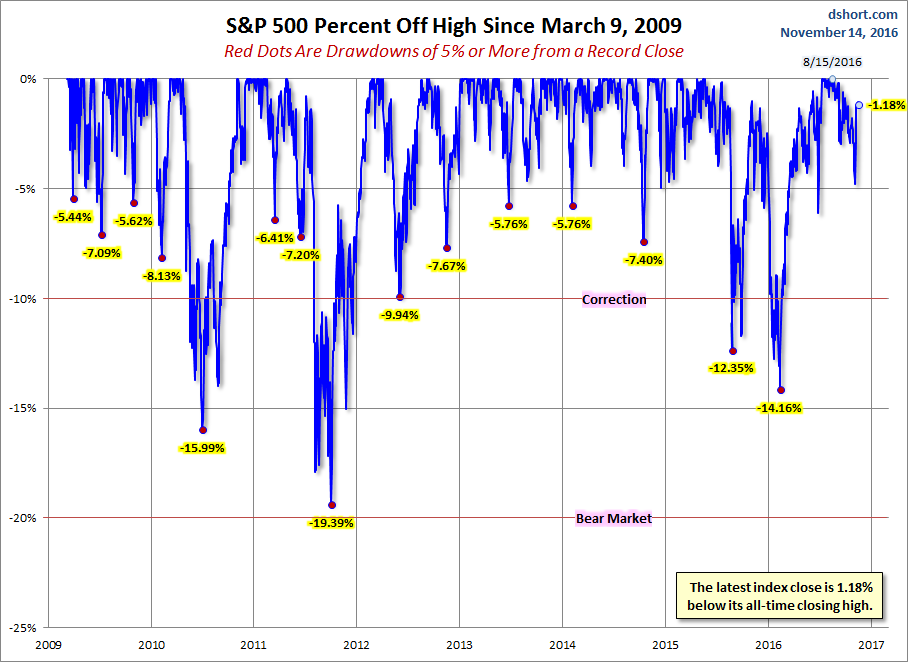
A Perspective on Drawdowns
Here's a snapshot of selloffs since the 2009 trough.
(Click on image to enlarge)
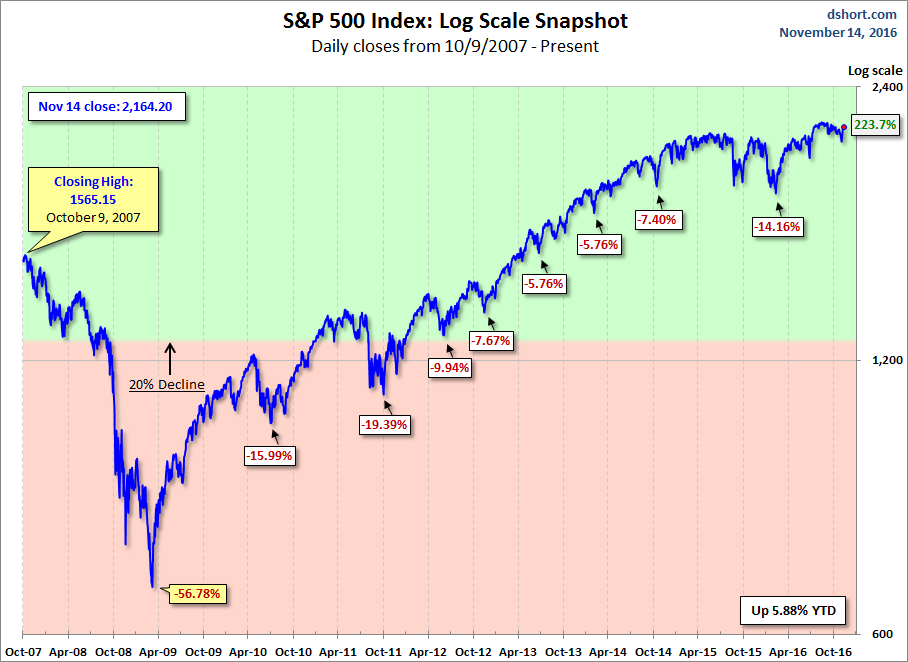
Here is a more conventional log-scale chart with drawdowns highlighted.
(Click on image to enlarge)
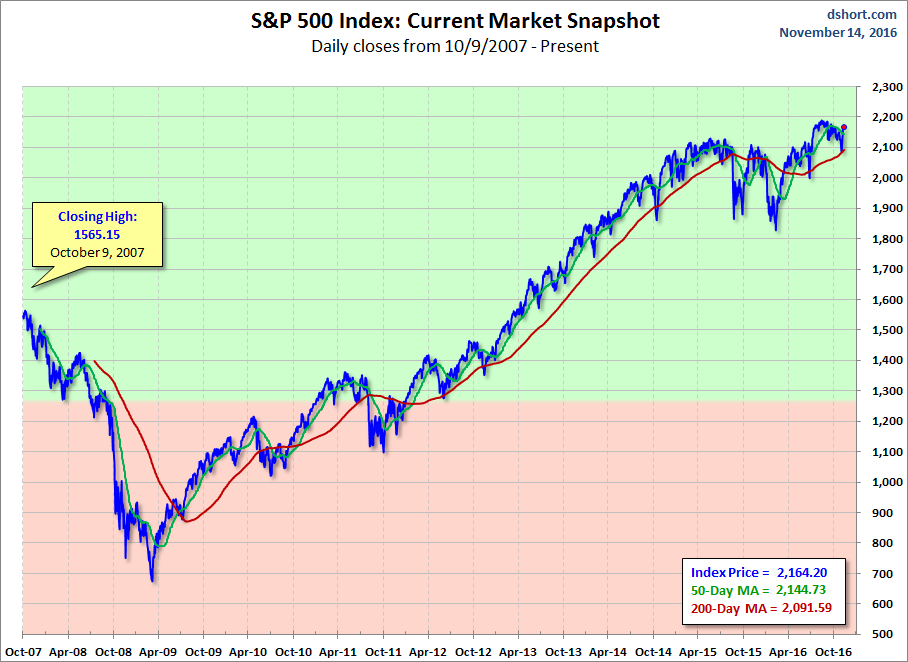
Here is a linear scale version of the same chart with the 50- and 200-day moving averages.
(Click on image to enlarge)
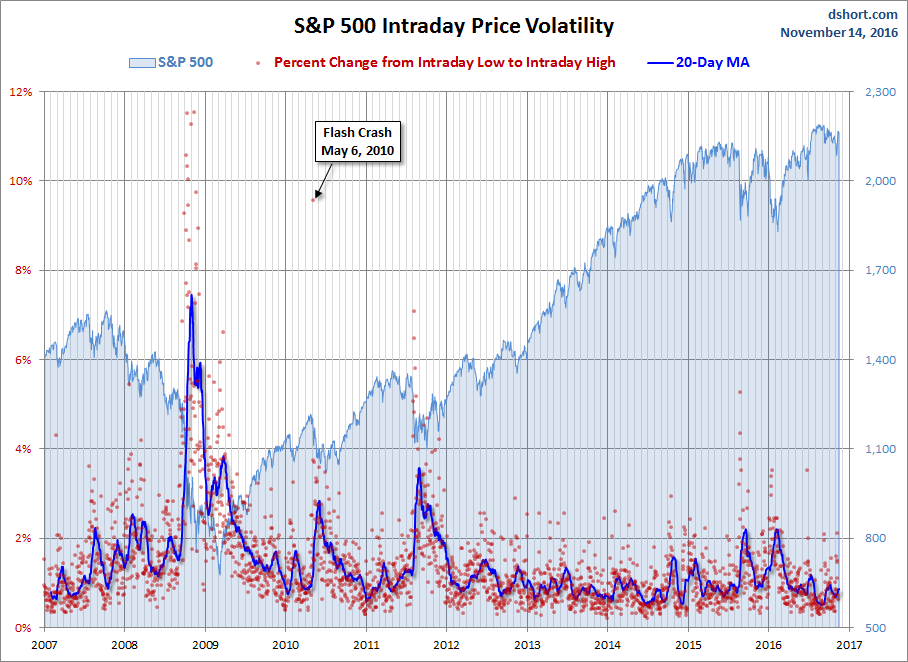
A Perspective on Volatility
For a sense of the correlation between the closing price and intraday volatility, the chart below overlays the S&P 500 since 2007 with the intraday price range. We've also included a 20-day moving average to help identify trends in volatility.
(Click on image to enlarge)
Disclosure: None.


Thanks for sharing