
S&P 500 Snapshot: First Record Close Of 2017
The S&P 500 did a double take at the open, triggered no doubt by the mixed bag monthly employment report and remained flat through the first half of the morning yesterday. It then rallied steadily to a narrow trading range that included its mid-afternoon 0.58% intraday high. It then drifted lower to its 0.35% closing gain, the first record close of 2016.
Here is a snapshot of the past five sessions.
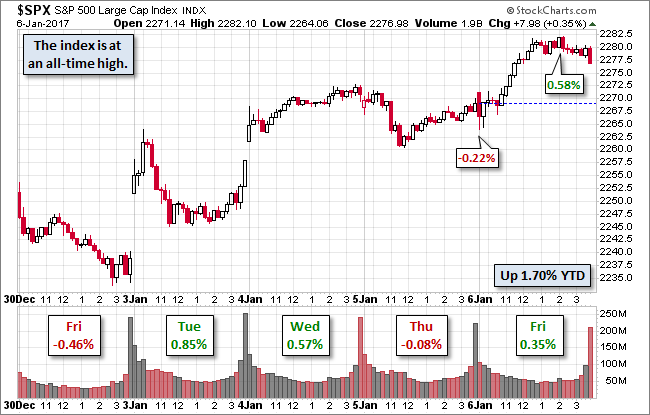
The yield on the 10-year note closed at 2.42%, up five BPs from the previous close.
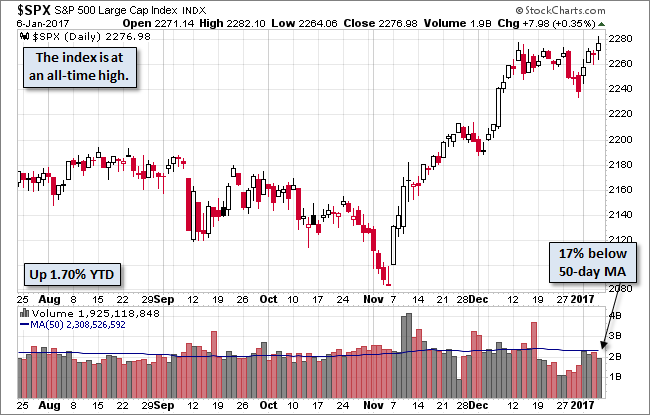
Here is daily chart of the index. Trading volume was light on today's record close.
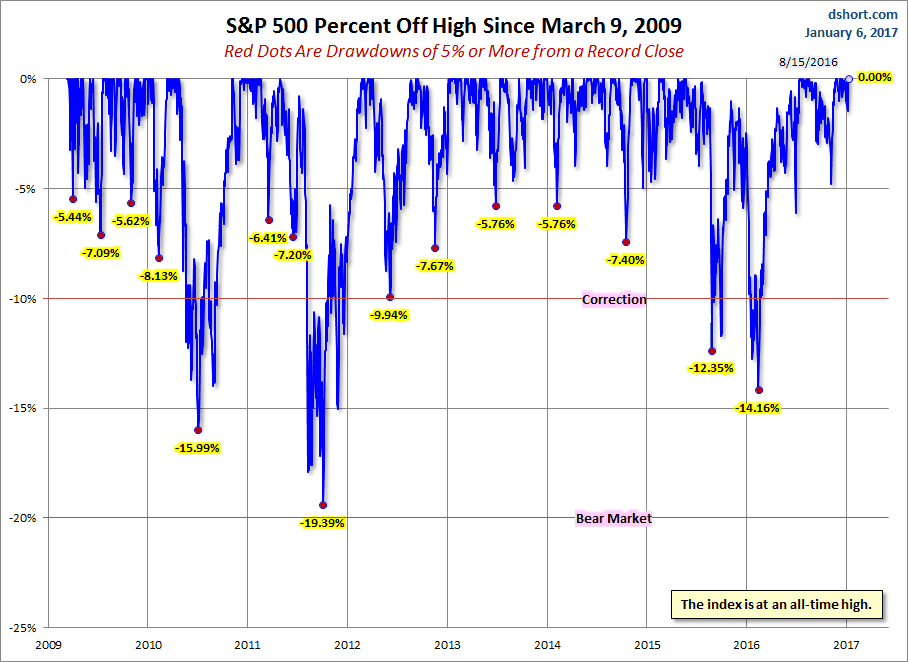
A Perspective on Drawdowns
Here's a snapshot of record highs and selloffs since the 2009 trough.
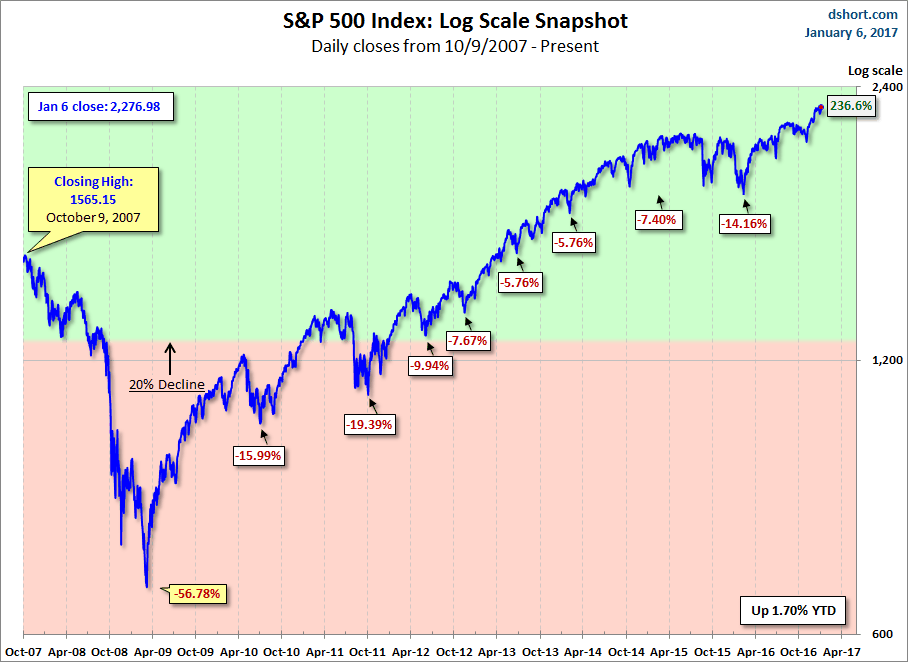
Here is a more conventional log-scale chart with drawdowns highlighted.
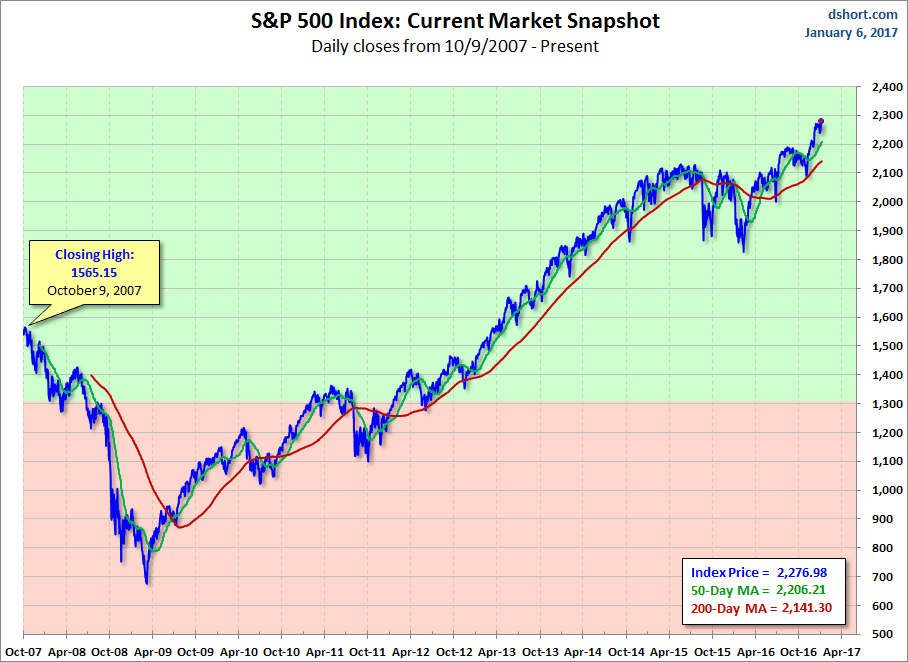
Here is a linear scale version of the same chart with the 50- and 200-day moving averages.
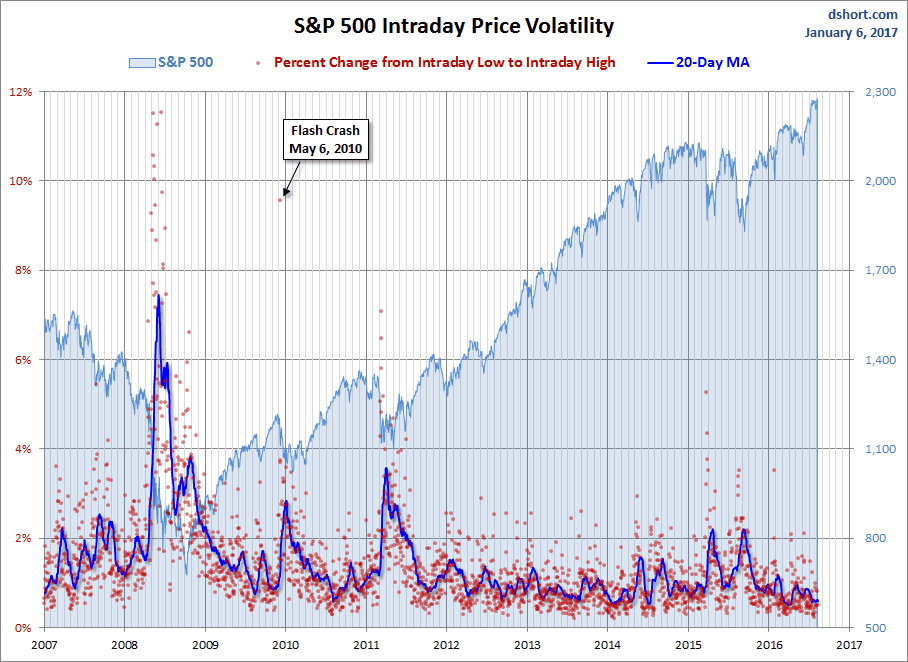
A Perspective on Volatility
For a sense of the correlation between the closing price and intraday volatility, the chart below overlays the S&P 500 since 2007 with the intraday price range. We've also included a 20-day moving average to help identify trends in volatility.
Disclosure: None.


Thanks for sharing Sir. Merry Christmas