
S&P 500 Snapshot: Erasing Friday's Gain To A Record Close
The S&P 500 opened lower and hit its -0.34% morning low about 15 minutes into the session before rallying to its -0.07% intraday high in the late morning. The index then zig-zagged lower and appeared to bounce off the level of that morning low shortly before the final hour of trading. But the bounce didn't hold, and the 500 closed the session a tick lower than that morning low at -0.35%. Today's loss erased Friday's 0.35% gain to a record close.
Here is a snapshot of the past five sessions. Curiously, our go-to source for the undocumented charts didn't record the intraday volume granularity.
(Click on image to enlarge)
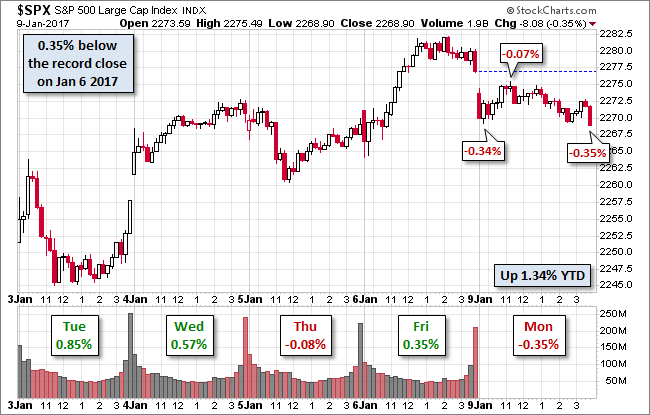
The yield on the 10-year note closed at 2.38%, down four BPs from the previous close.
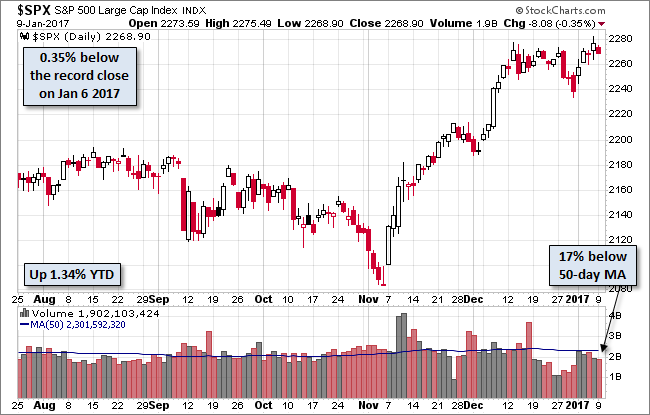
Here is a daily chart of the index, which does show today's total volume, which remains on the light side. Are investors waiting on more evidence of a Trump effect on the market? Stay tuned.
(Click on image to enlarge)
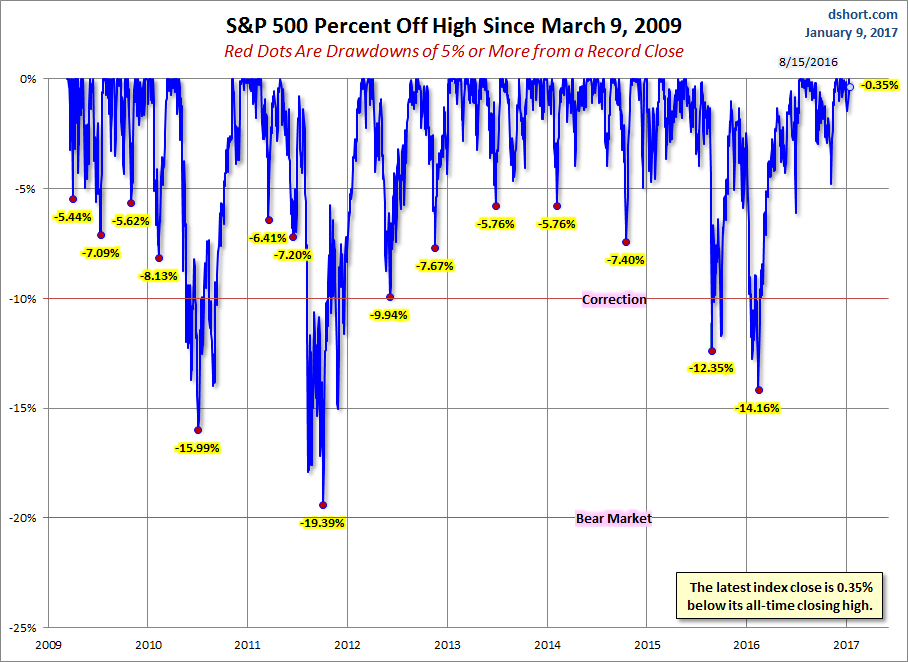
A Perspective on Drawdowns
Here's a snapshot of record highs and selloffs since the 2009 trough.
(Click on image to enlarge)
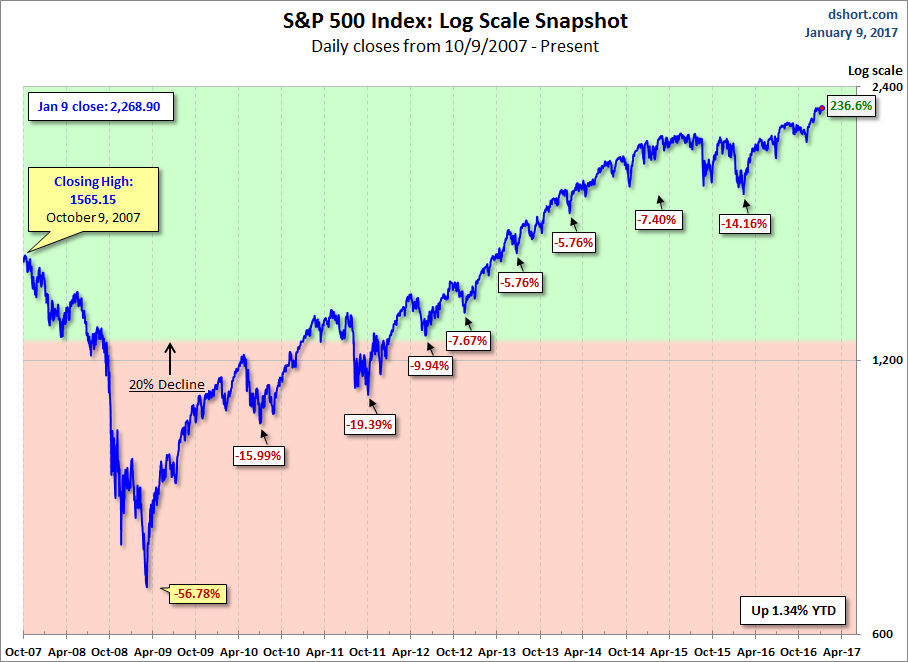
Here is a more conventional log-scale chart with drawdowns highlighted.
(Click on image to enlarge)
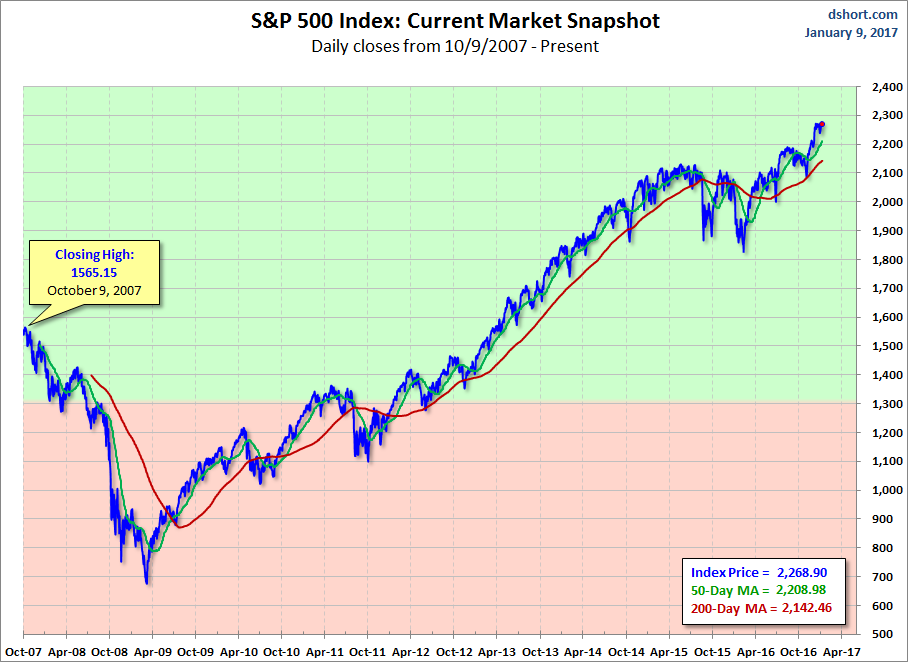
Here is a linear scale version of the same chart with the 50- and 200-day moving averages.
(Click on image to enlarge)
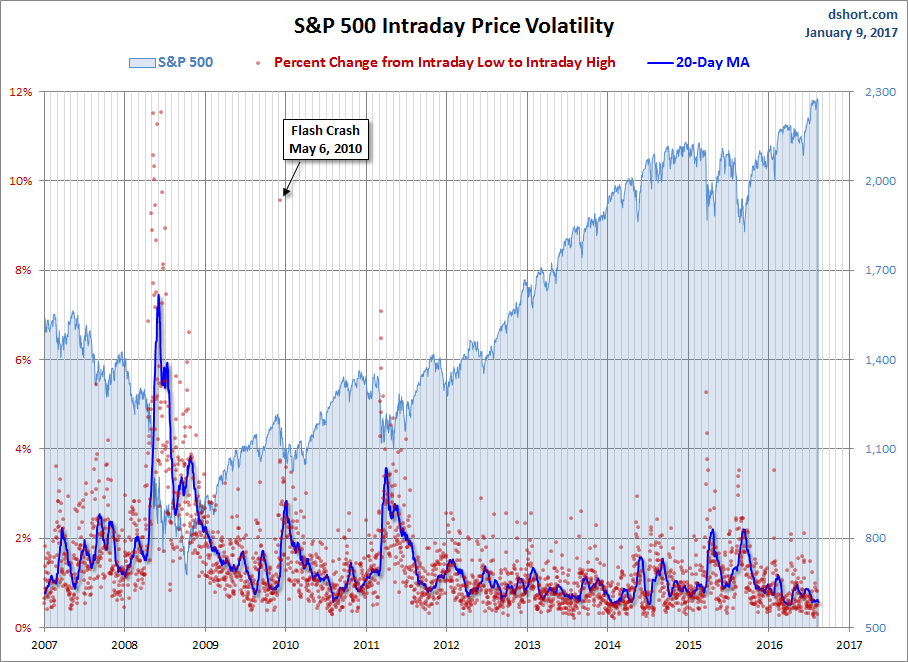
A Perspective on Volatility
For a sense of the correlation between the closing price and intraday volatility, the chart below overlays the S&P 500 since 2007 with the intraday price range. We've also included a 20-day moving average to help identify trends in volatility.
(Click on image to enlarge)
Disclosure: None.


thanks for sharing