
S&P 500 Snapshot: Another Advance And Just Shy Of A Record Close
Equity indexes around the globe rallied today, with the Dow ending the session at another record close. The S&P 500 posted a modest gain of 0.34%, just a tad off its intraday high and a mere 0.05% from its latest record close on November 25th. But from an international perspective, the big winner today was the Italy's FTSE MIB, up 4.15%. Of course, the MIB is still down 17.09% year-to-date.
The yield on the 10-year note closed at 2.39%, unchanged from its previous close.
(Click on image to enlarge)
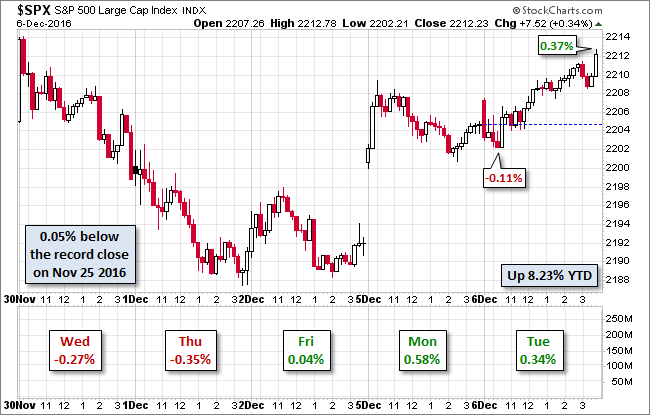
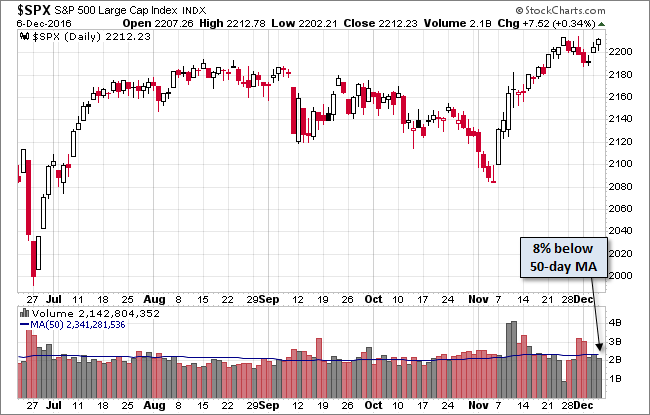
Here is a daily chart of the index. Trading volume was a bit on the light side.
(Click on image to enlarge)
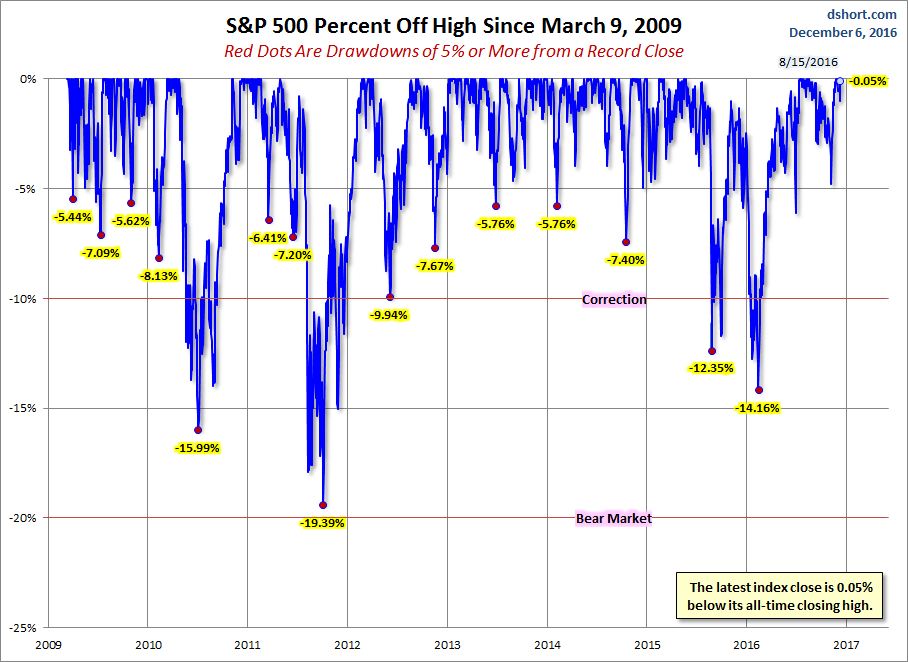
A Perspective on Drawdowns
Here's a snapshot of selloffs since the 2009 trough.
(Click on image to enlarge)
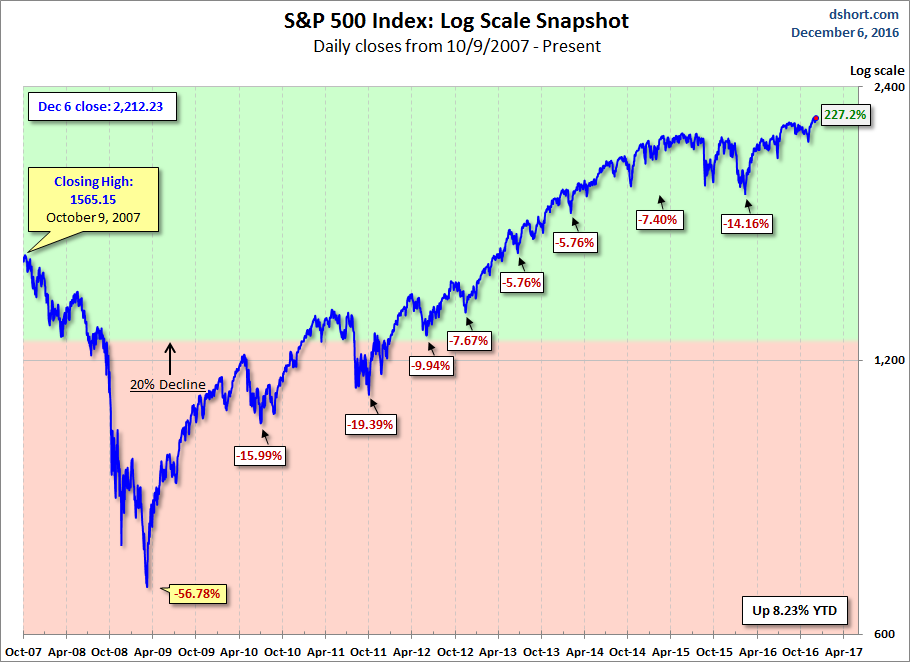
Here is a more conventional log-scale chart with drawdowns highlighted.
(Click on image to enlarge)
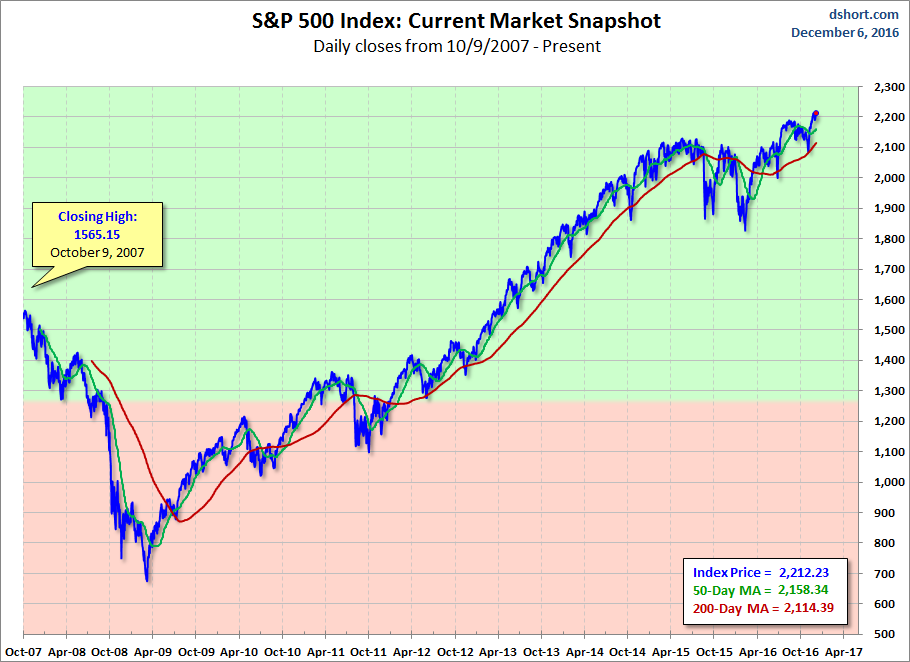
Here is a linear scale version of the same chart with the 50- and 200-day moving averages.
(Click on image to enlarge)
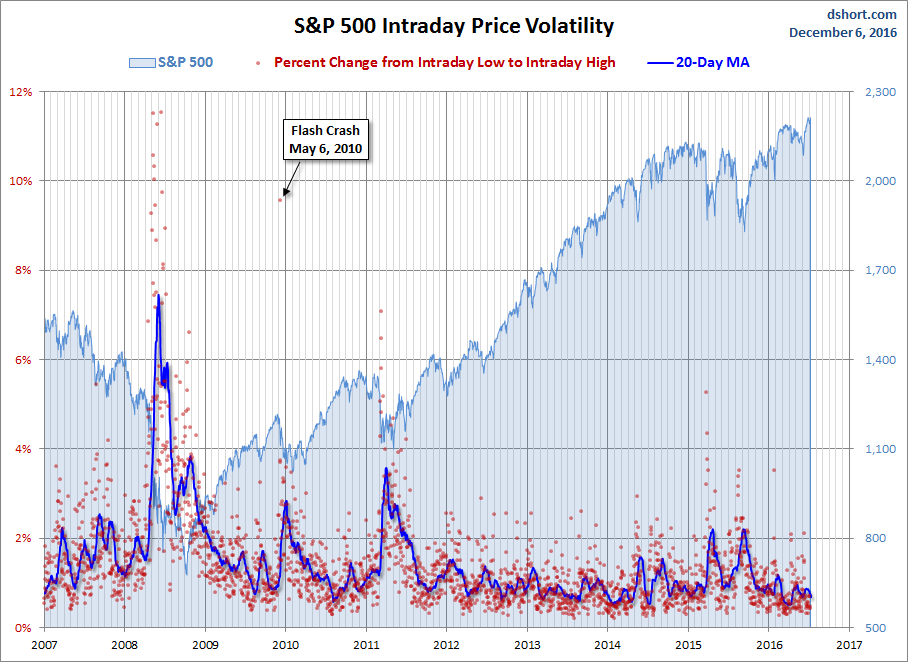
A Perspective on Volatility
For a sense of the correlation between the closing price and intraday volatility, the chart below overlays the S&P 500 since 2007 with the intraday price range. We've also included a 20-day moving average to help identify trends in volatility.
(Click on image to enlarge)
Disclosure: None.


thanks for sharing