
S&p 500 Snapshot: Another Advance And Just Shy Of A Record Close - Jan. 4
On the second market day of 2016 the S&P 500 posted another advance, up 0.57% and just 0.04% below its December 13th record close. In fact the 0.66% intraday high about 17 minutes before the close was above that December close.
Here is a snapshot of the past five sessions.
(Click on image to enlarge)
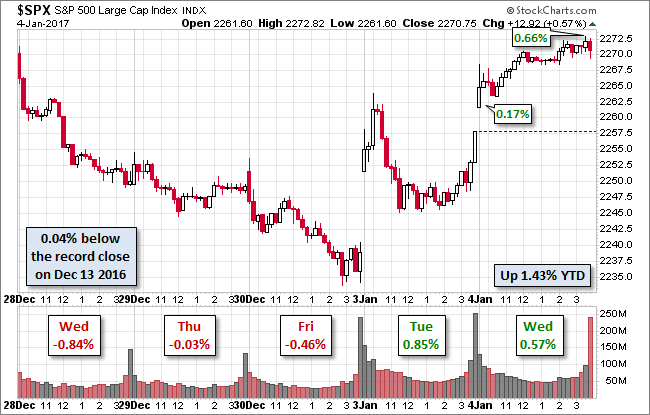
The yield on the 10-year note closed at 2.46%, up one BP from the previous close.
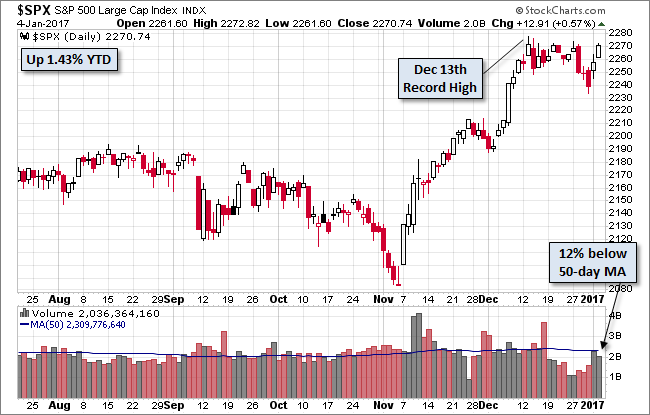
Here is daily chart of the index. Trading volume eased a bit on today's advance.
(Click on image to enlarge)
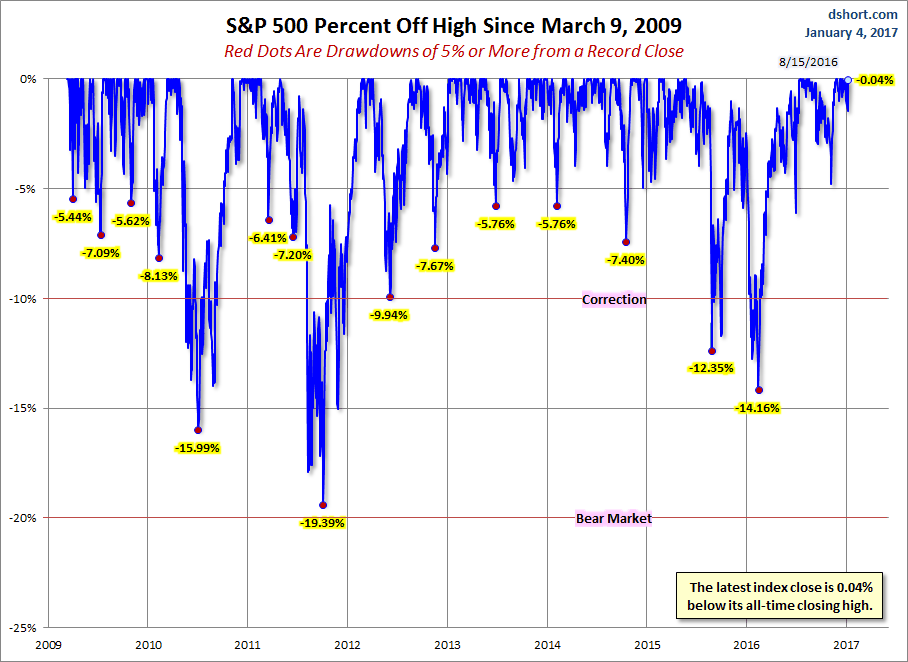
Perspective on Drawdowns
Here's a snapshot of record highs and selloffs since the 2009 trough.
(Click on image to enlarge)
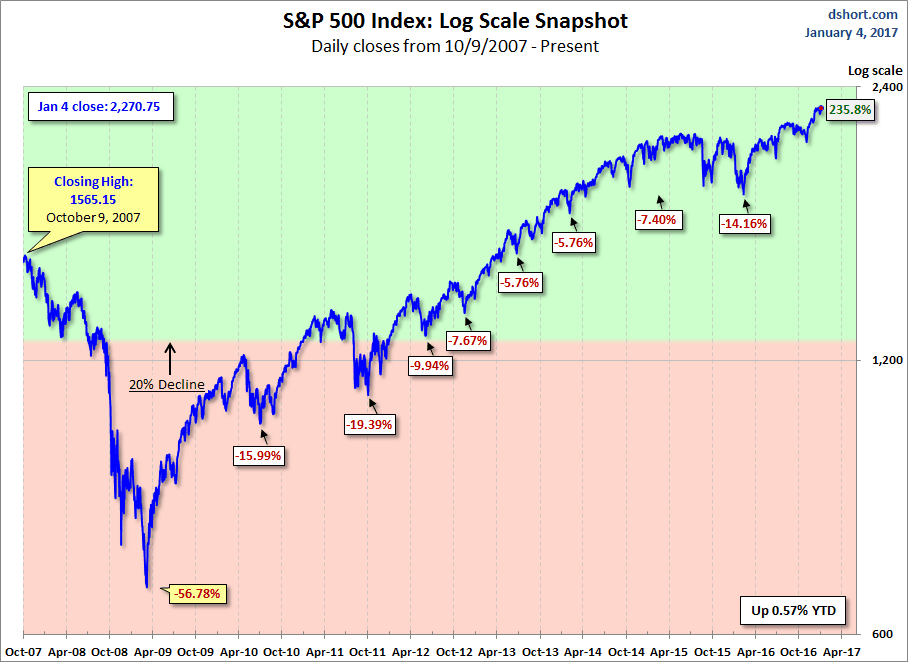
Here is a more conventional log-scale chart with drawdowns highlighted.
(Click on image to enlarge)
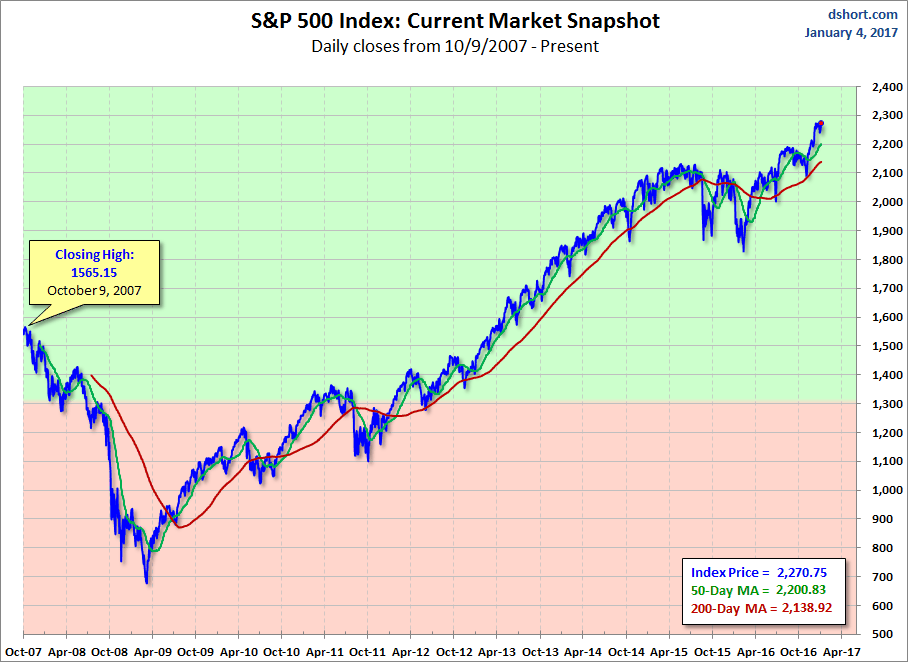
Here is a linear scale version of the same chart with the 50- and 200-day moving averages.
(Click on image to enlarge)
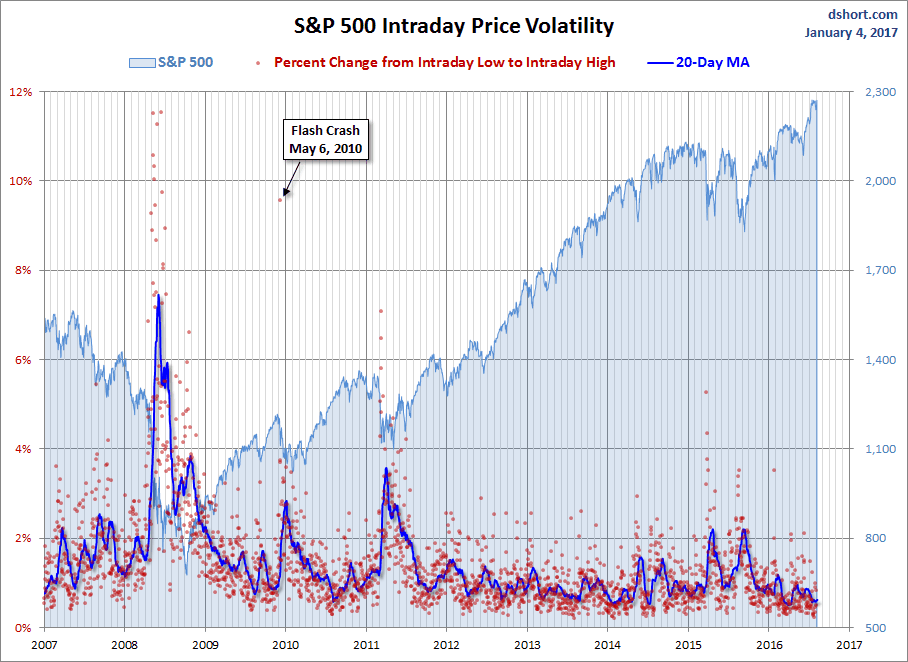
A Perspective on Volatility
For a sense of the correlation between the closing price and intraday volatility, the chart below overlays the S&P 500 since 2007 with the intraday price range. We've also included a 20-day moving average to help identify trends in volatility.
(Click on image to enlarge)
Disclosure: None.


