
S&P 500 Snapshot: A Strong Start To 2017
The S&P 500 ushered in the first day of 2017 with a surge at the open, rising to its 1.12% intraday high about 40 minutes into the session. A short-term "book the gains" mentality sent the index to its 0.28% late-morning intraday low. After a narrow mid-day trade, the rally mindset returned and accelerated in the final hour. The index closed with a 0.85% gain to start the new year.
Here is a snapshot of the past five sessions.
(Click on image to enlarge)
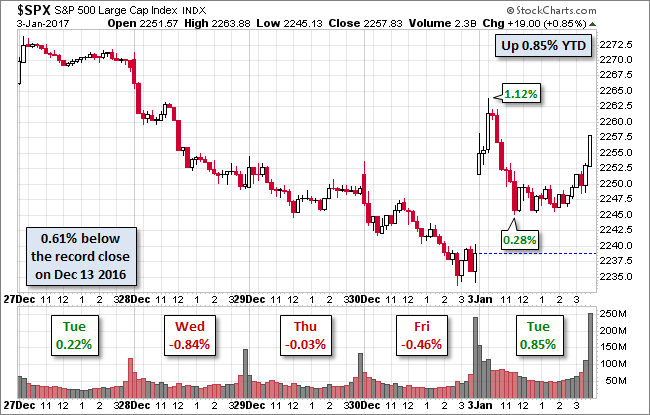
The yield on the 10-year note closed at 2.45%, down unchanged from the previous close.
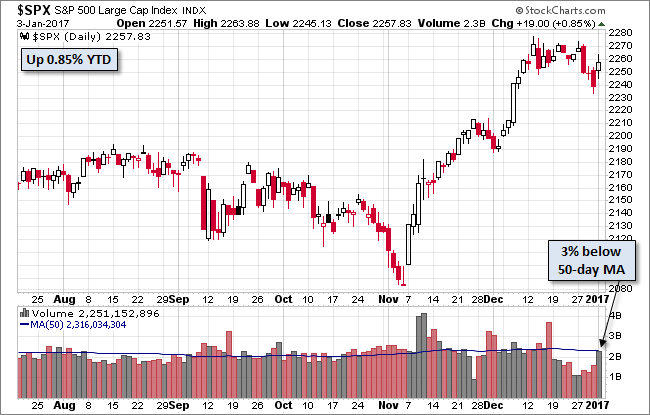
Here is daily chart of the index. Trading volume has recovered from the holiday slack to normal levels.
(Click on image to enlarge)
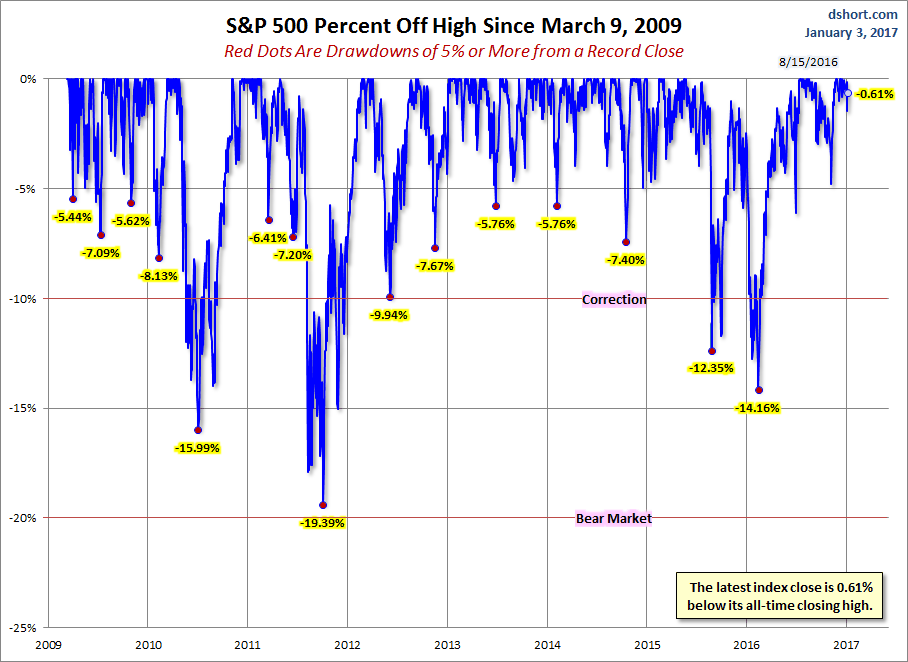
A Perspective on Drawdowns
Here's a snapshot of selloffs since the 2009 trough.
(Click on image to enlarge)
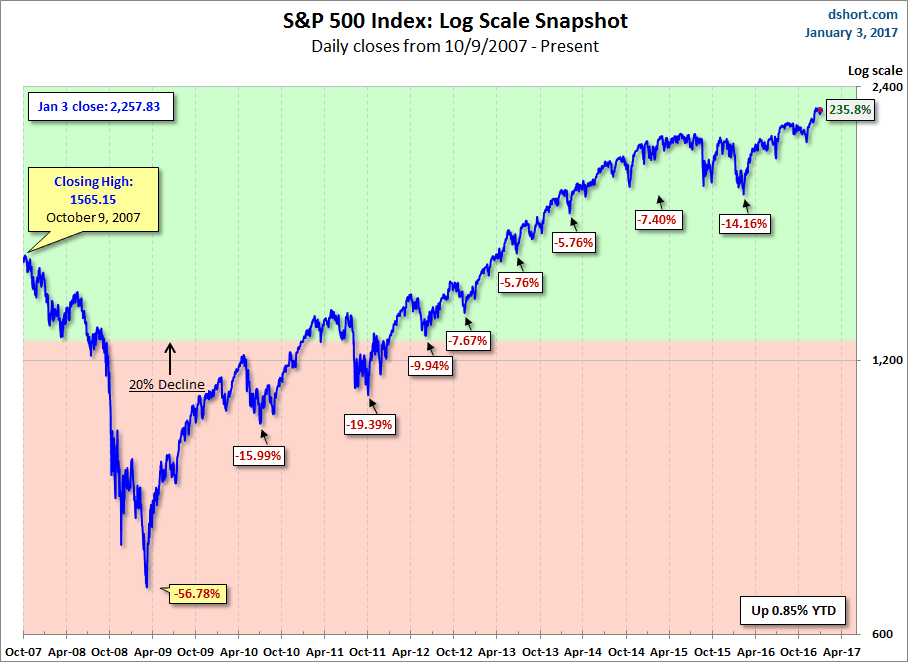
Here is a more conventional log-scale chart with drawdowns highlighted.
(Click on image to enlarge)
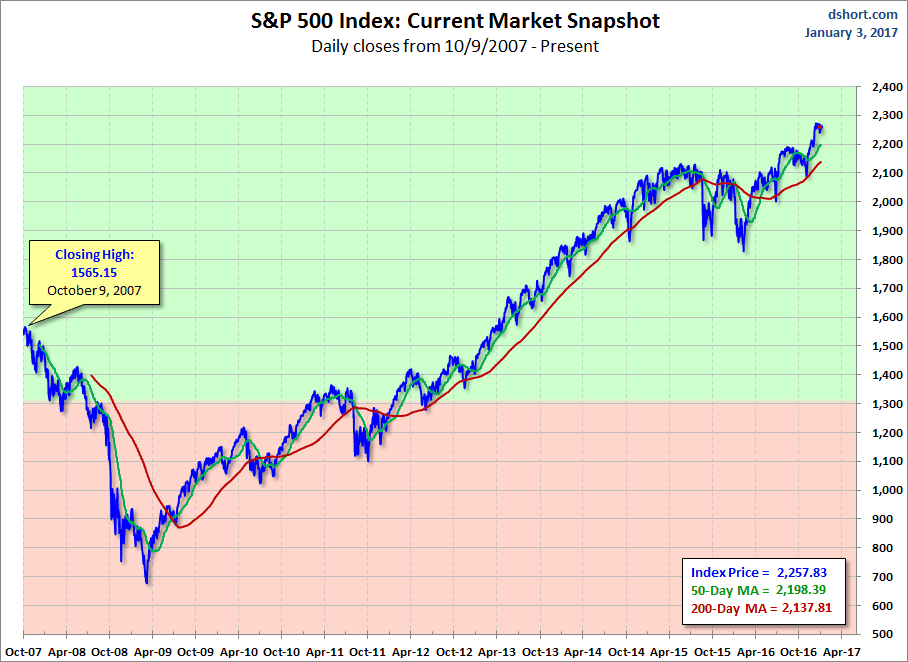
Here is a linear scale version of the same chart with the 50- and 200-day moving averages.
(Click on image to enlarge)
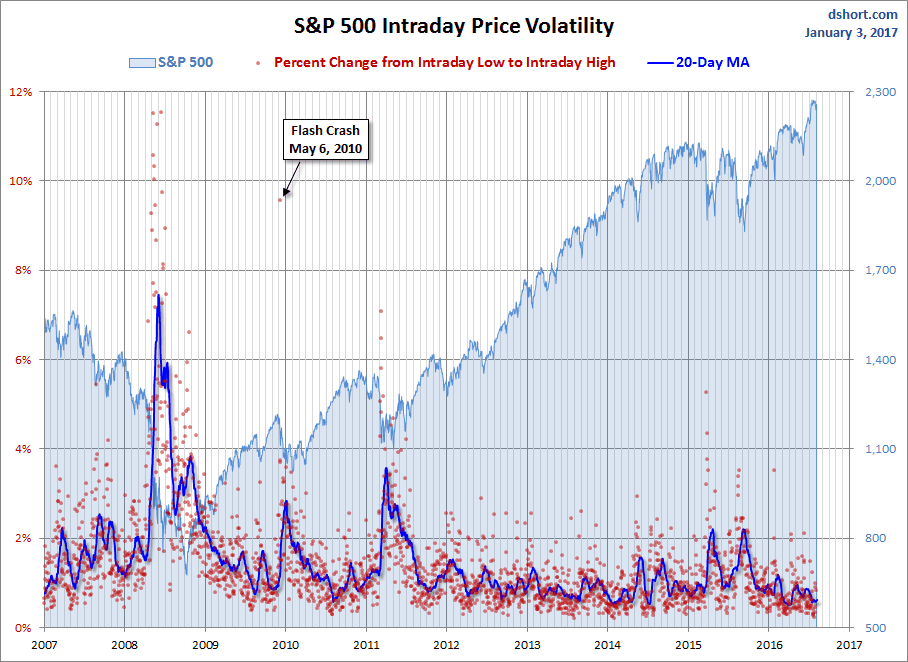
A Perspective on Volatility
For a sense of the correlation between the closing price and intraday volatility, the chart below overlays the S&P 500 since 2007 with the intraday price range. We've also included a 20-day moving average to help identify trends in volatility.
(Click on image to enlarge)
Disclosure: None.


