
S&P 500 Snapshot: A Record Close
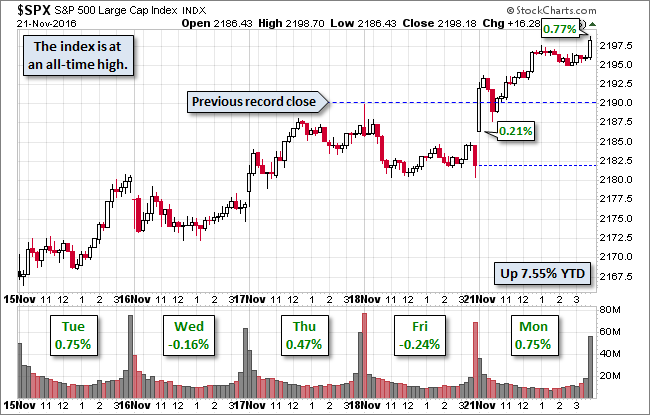
The S&P 500 finally matched its cousins the Dow and Nasdaq in setting a record close, finally breaking its previous record close on August 15th. The index broke that previous record in the opening minutes, briefly slipped back below that benchmark and then rallied to its afternoon trading range. Another pop in the final minutes lifted it to is 0.77% intraday high shortly before the 0.75% official closing tally.
The yield on the 10-year note was little changed, closing at 2.33%, down one BP from the previous close.
Here is a snapshot of the past five sessions.
(Click on image to enlarge)
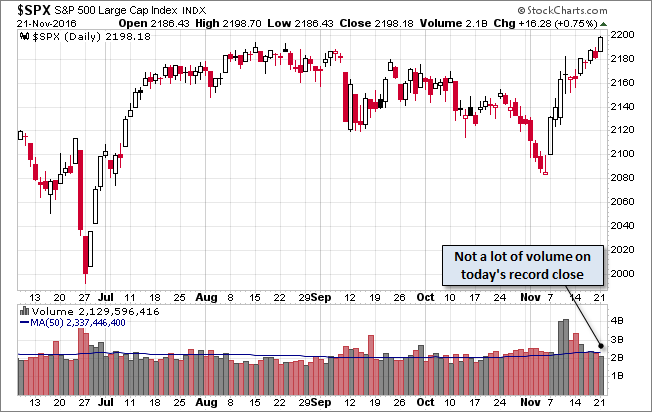
Here's a daily chart of the S&P 500. Trading volume was unremarkable on today's record close.
(Click on image to enlarge)
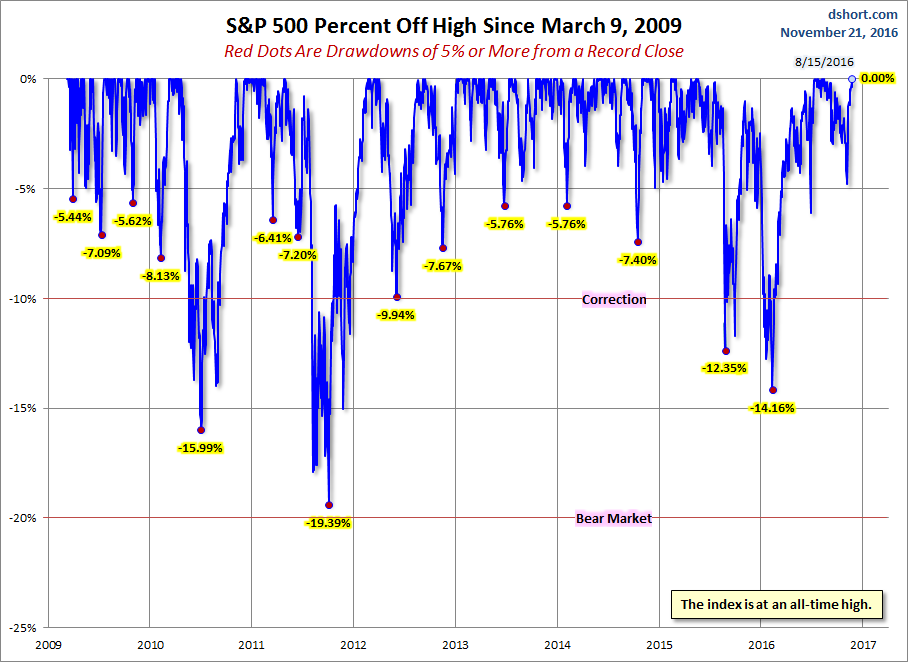
A Perspective on Drawdowns
Here's a snapshot of selloffs since the 2009 trough.
(Click on image to enlarge)
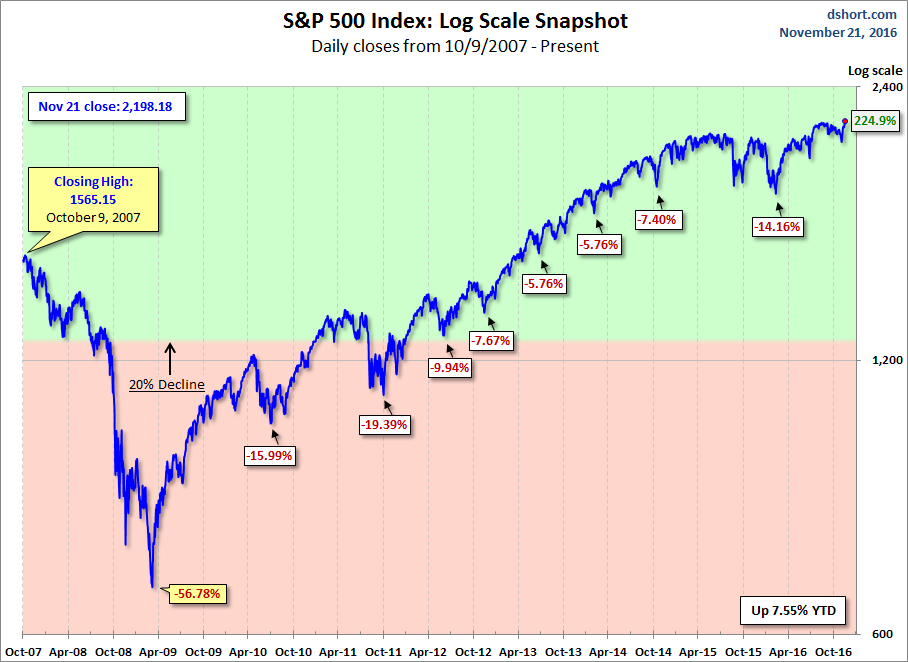
Here is a more conventional log-scale chart with drawdowns highlighted.
(Click on image to enlarge)
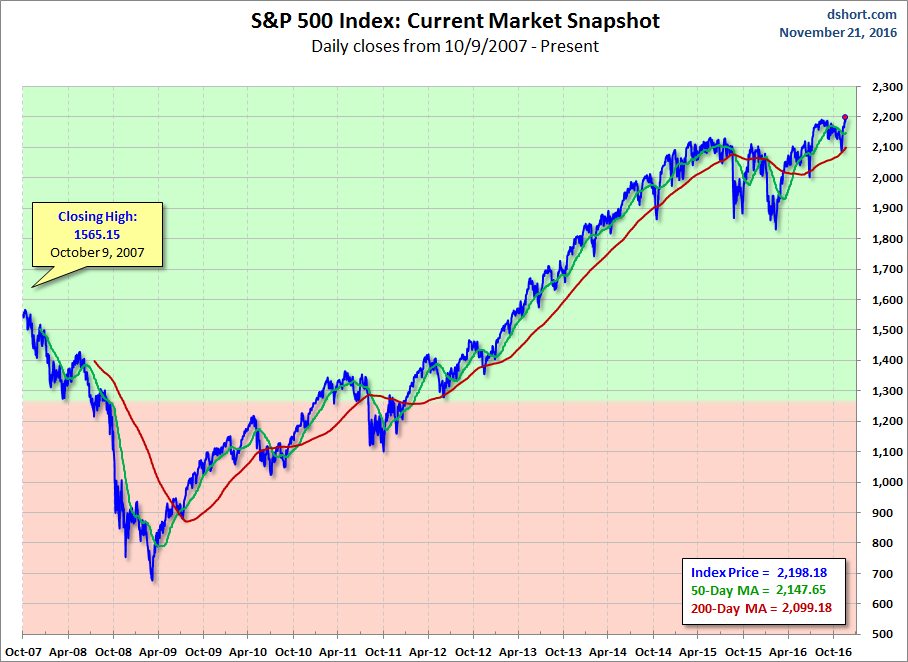
Here is a linear scale version of the same chart with the 50- and 200-day moving averages.
(Click on image to enlarge)
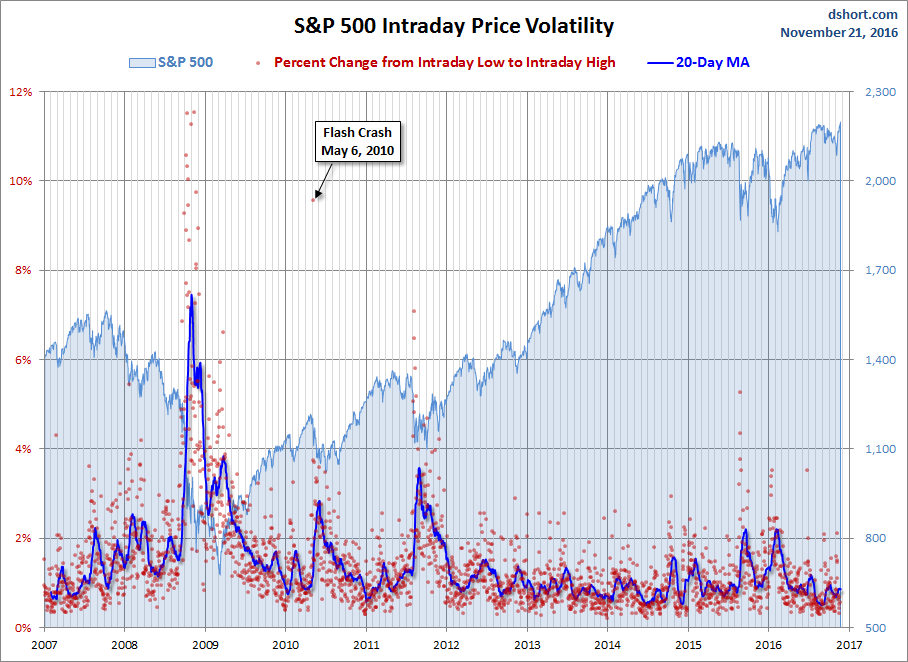
A Perspective on Volatility
For a sense of the correlation between the closing price and intraday volatility, the chart below overlays the S&P 500 since 2007 with the intraday price range. We've also included a 20-day moving average to help identify trends in volatility.
(Click on image to enlarge)
Disclosure: None.


Thanks and Merry Christmas