
S&P 500 Snapshot: A Modest Gain On A Surge In Oil
Oil surged today, with West Texas Crude up 3.09%. The S&P 500 rallied at the open to its 0.74% intraday high 20 minutes into the session. It then traded sideways until late morning and then gradually drifted downward to its more modest closing gain of 0.46%.
Here is a snapshot of past five sessions in the S&P 500.
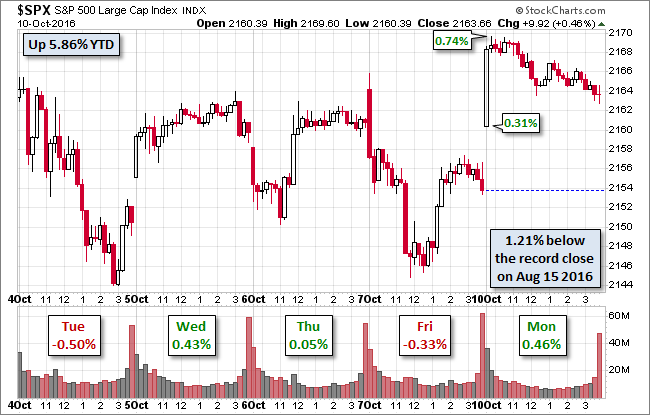
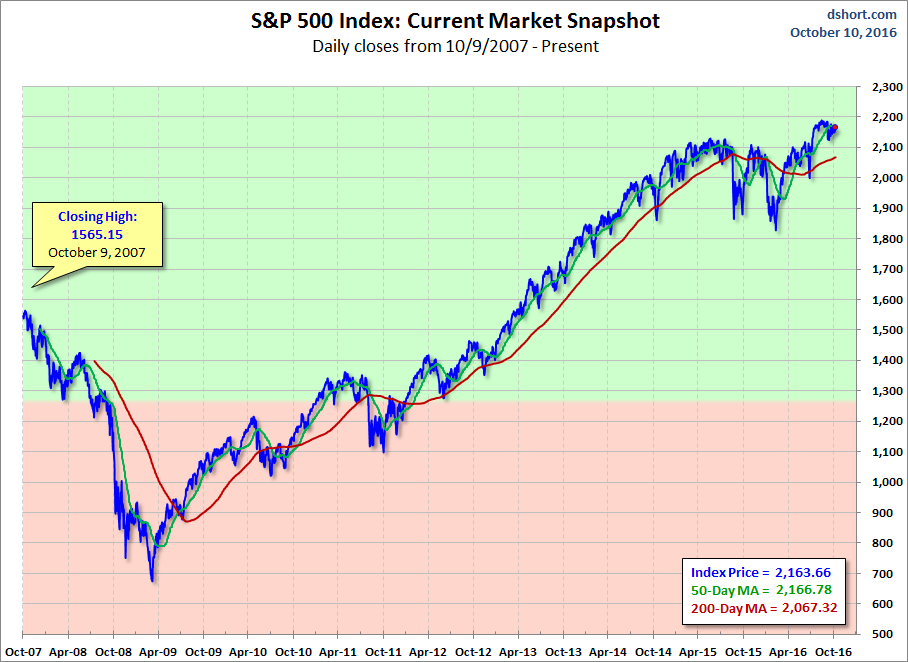
This afternoon Gallup released the results of its Q3 survey of investor confidence, a joint effort with Wells Fargo. The headline says it all: U.S. Investor Optimism Index Climbs to Nine-Year High, the highest since July 2007. Interestingly enough, the S&P 500 hit its pre-crash peak on October 9, 2007 — the ninth anniversary of which was yesterday.
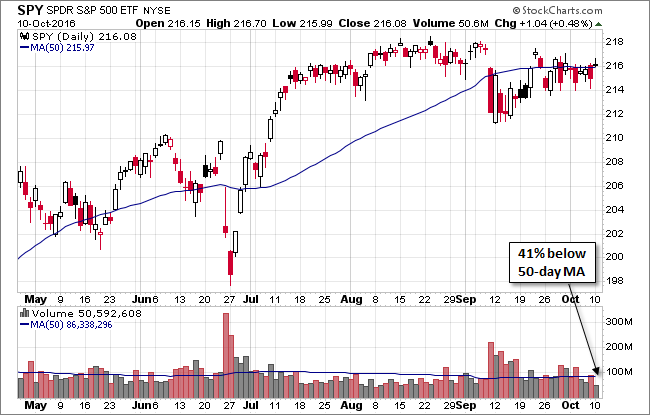
Here is daily chart of the SPY ETF, which gives a better sense of investor participation in today's trade. Volume was 41% below its 50-day moving average. In fact, over the approximately five and a half month in the chart below, volume has generally been light on gains and stronger on declines.
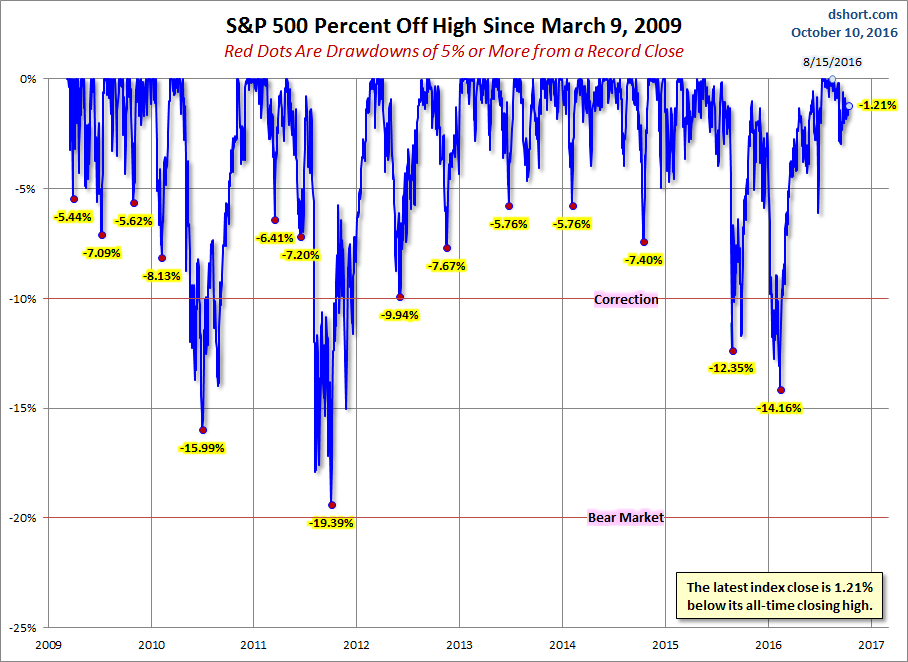
A Perspective on Drawdowns
Here's a snapshot of selloffs since the 2009 trough.
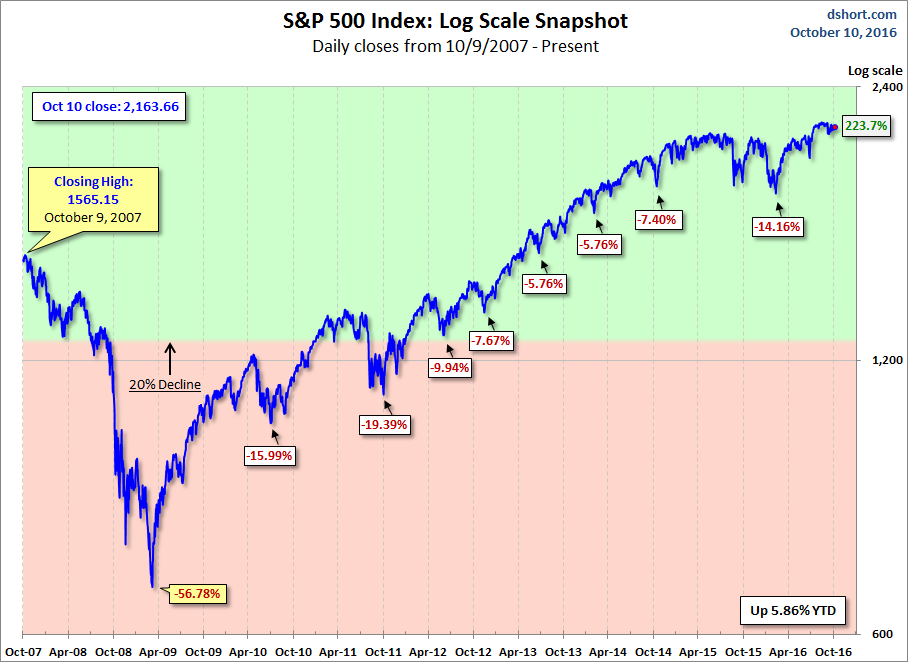
Here is a more conventional log-scale chart with drawdowns highlighted.
Here is a linear scale version of the same chart with the 50- and 200-day moving averages.
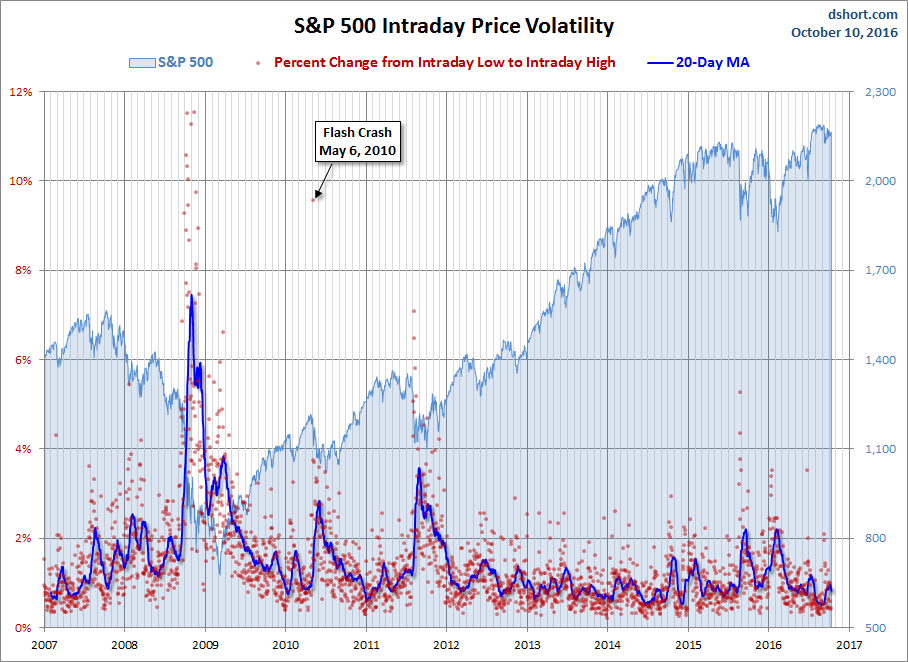
A Perspective on Volatility
For a sense of the correlation between the closing price and intraday volatility, the chart below overlays the S&P 500 since 2007 with the intraday price range. We've also included a 20-day moving average to help identify trends in volatility.
Disclosure: None.


Thanks for sharing