
S&P 500 Snapshot: A Low-Volume FBI Relief Rally
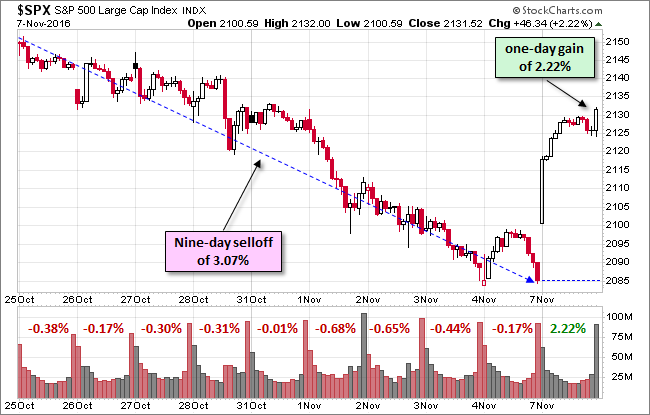
The S&P 500's nine-day sell-off, the longest in nearly 36 years, ended today with a relief rally triggered by the FBI. A letter to Congress on Sunday from FBI Director James Comey reaffirmed its earlier stance on Hillary's email server. Today's pre-election surge of 2.22% wiped out about 70% of that nine-day sell-off.
The 10-year Note closed the session at 1.83%, up four BPs from the previous close.
Instead of our usual snapshot of past five sessions in the S&P 500, here is a 10-day look that includes the complete nine-day sell-off and today's bounce.
(Click on image to enlarge)
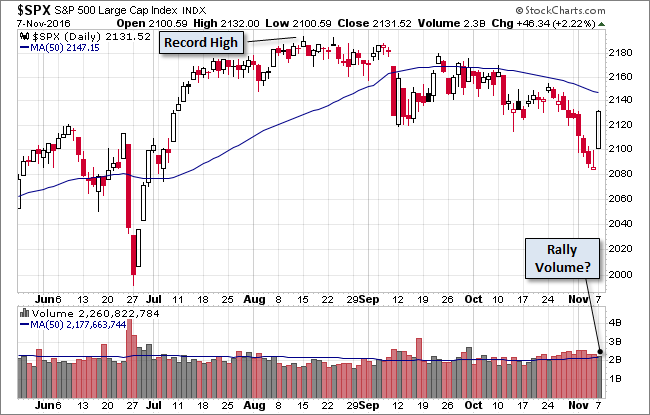
Here's a daily chart of the index. Check out the volume on today's rally ... not much conviction in advance of the election.
(Click on image to enlarge)
A Perspective on Drawdowns
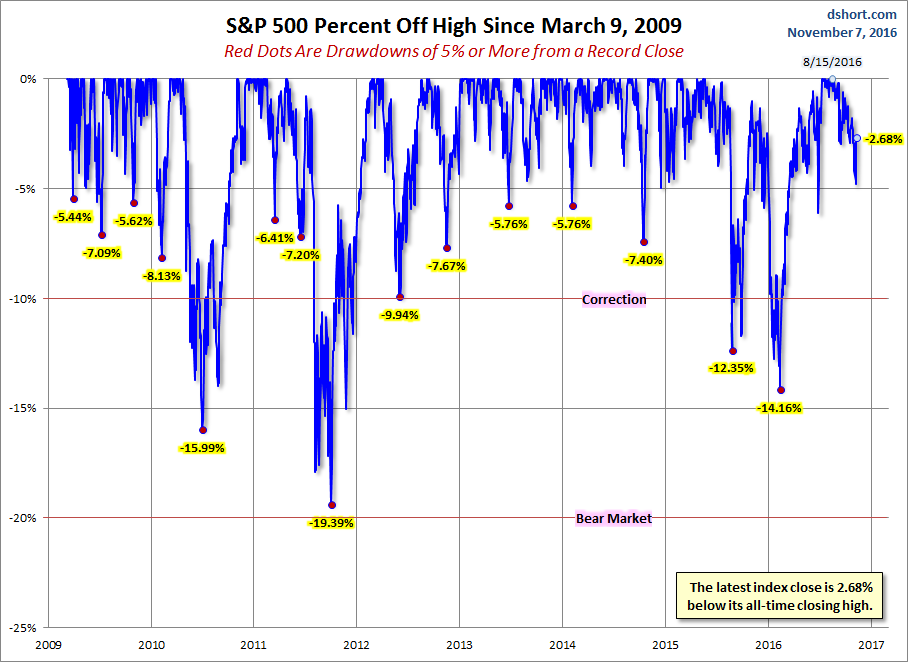
Here's a snapshot of sell-offs since the 2009 trough.
(Click on image to enlarge)
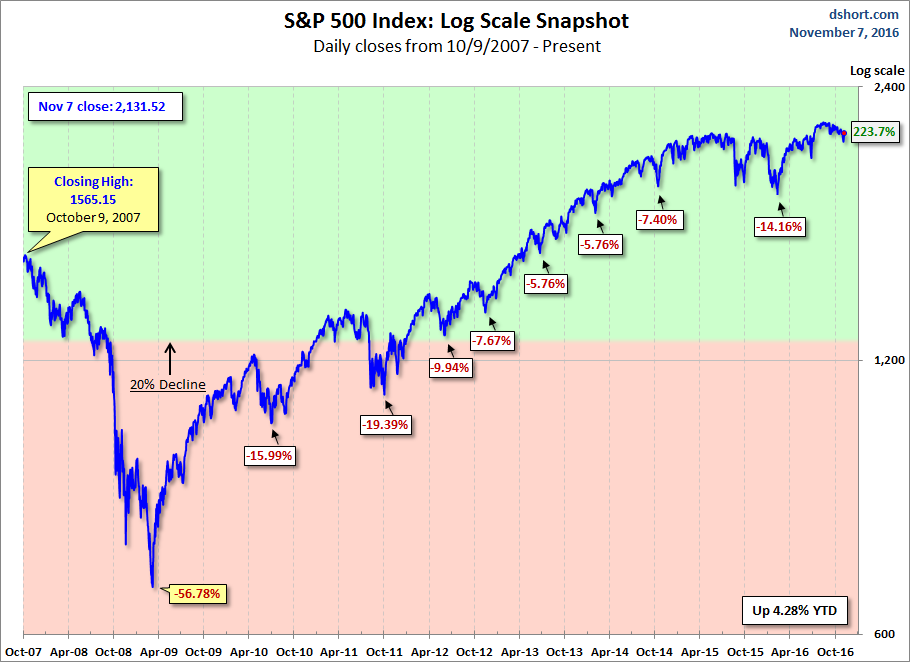
Here is a more conventional log-scale chart with drawdowns highlighted.
(Click on image to enlarge)
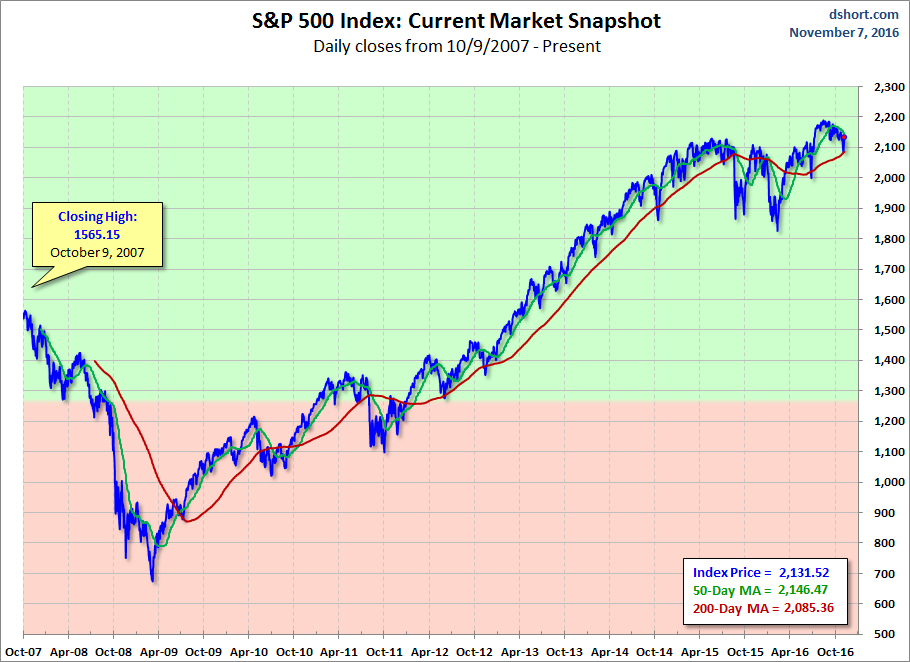
Here is a linear scale version of the same chart with the 50- and 200-day moving averages.
(Click on image to enlarge)
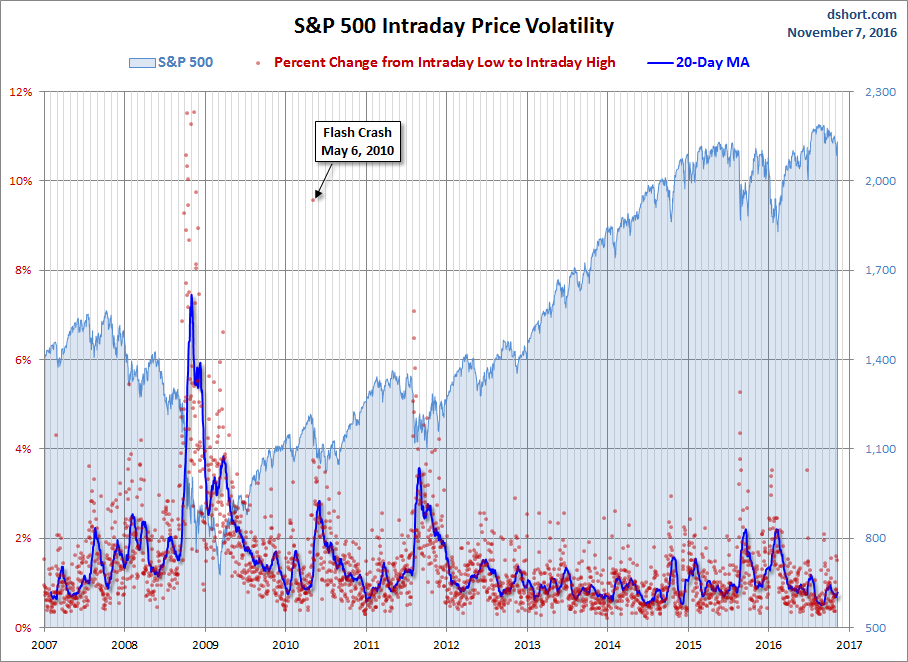
A Perspective on Volatility
For a sense of the correlation between the closing price and intraday volatility, the chart below overlays the S&P 500 since 2007 with the intraday price range. We've also included a 20-day moving average to help identify trends in volatility.
(Click on image to enlarge)
Disclosure: None.


thanks for sharing