
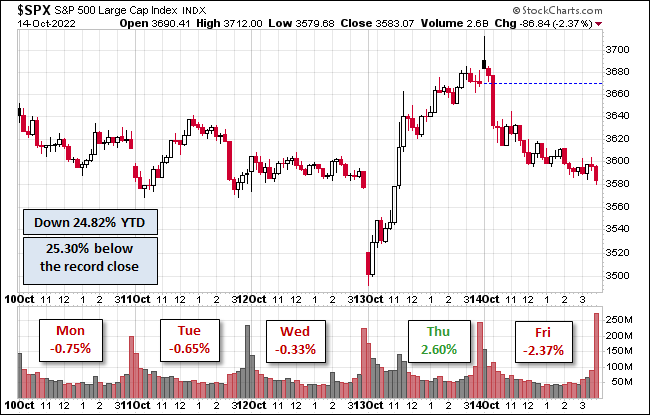
The S&P 500 is 25% below its record close and has closed in bear territory (more than 20% below its record close) for the last 18 consecutive business days. The index spent most of the week losing, closing Friday down 2.37% below Thursday's close.
(Click on image to enlarge)
The U.S. Treasury puts the closing yield on the 10-year note as of October 14 at 4.00% which is above its record low (0.52% on 8/4/2020). The 2-year note is at 4.48%. See our latest Treasury Snapshot here.
(Click on image to enlarge)
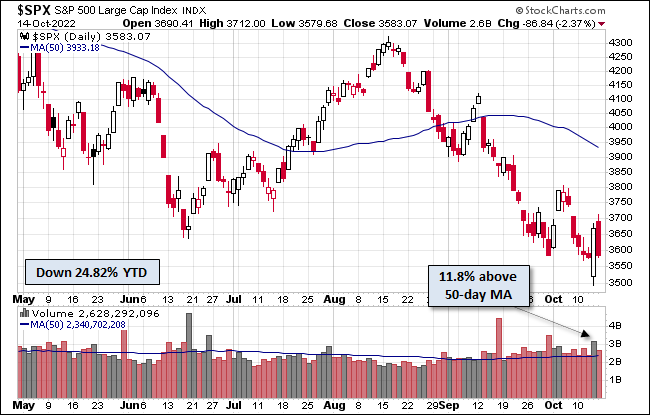
Here's a snapshot of the index going back to 2012.
(Click on image to enlarge)
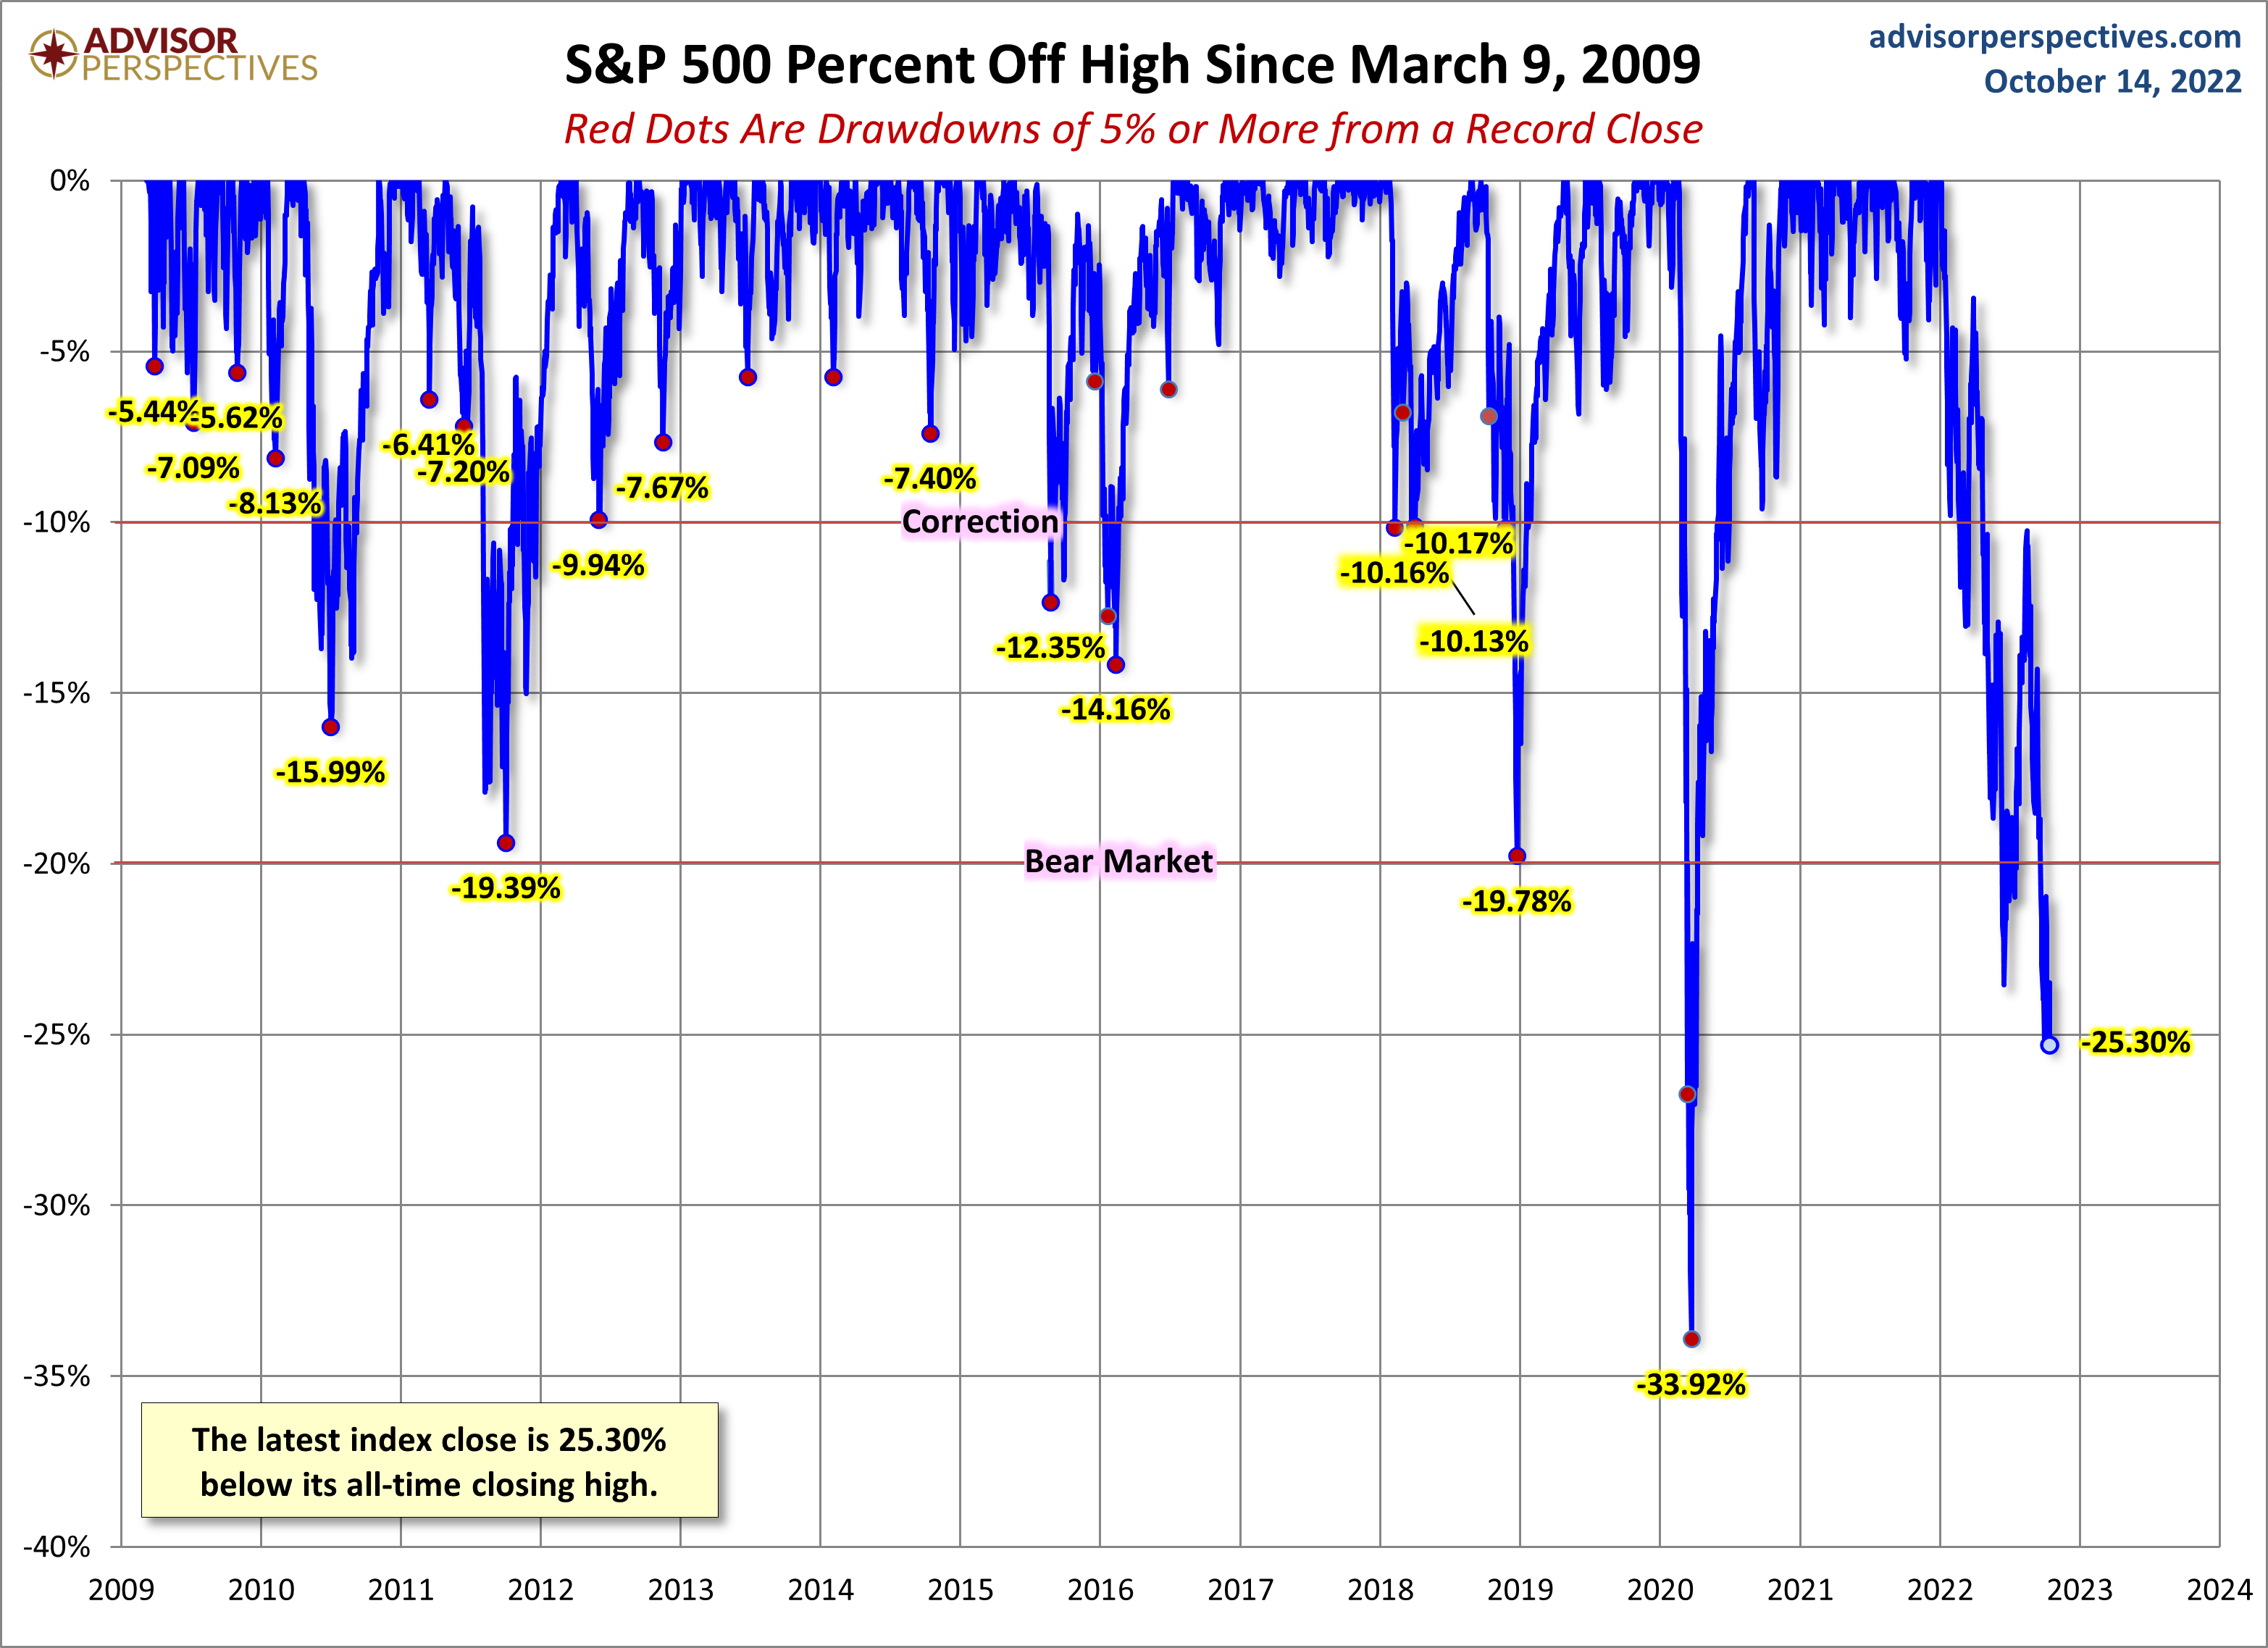
A Perspective on Drawdowns
Here's a snapshot of record highs and selloffs since the 2009 trough. Note the recent selloffs in 2022.
(Click on image to enlarge)
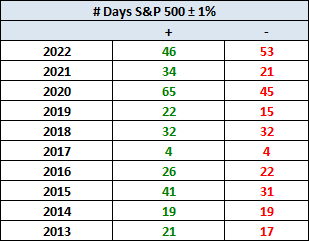
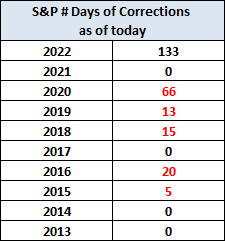
Here's a table with the number of days of a 1% or more change in either direction and the number of days of corrections (down 10% or more from the record high) going back to 2013.
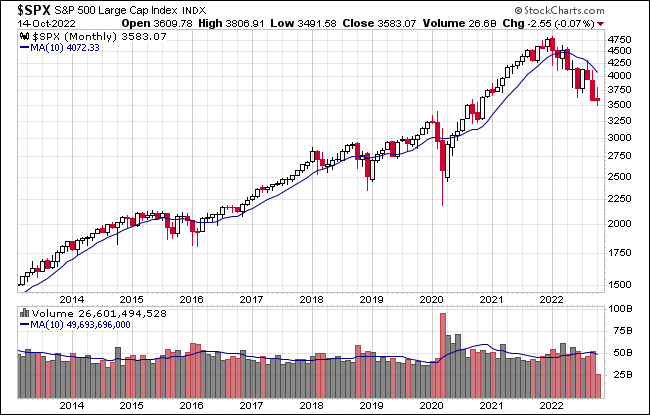
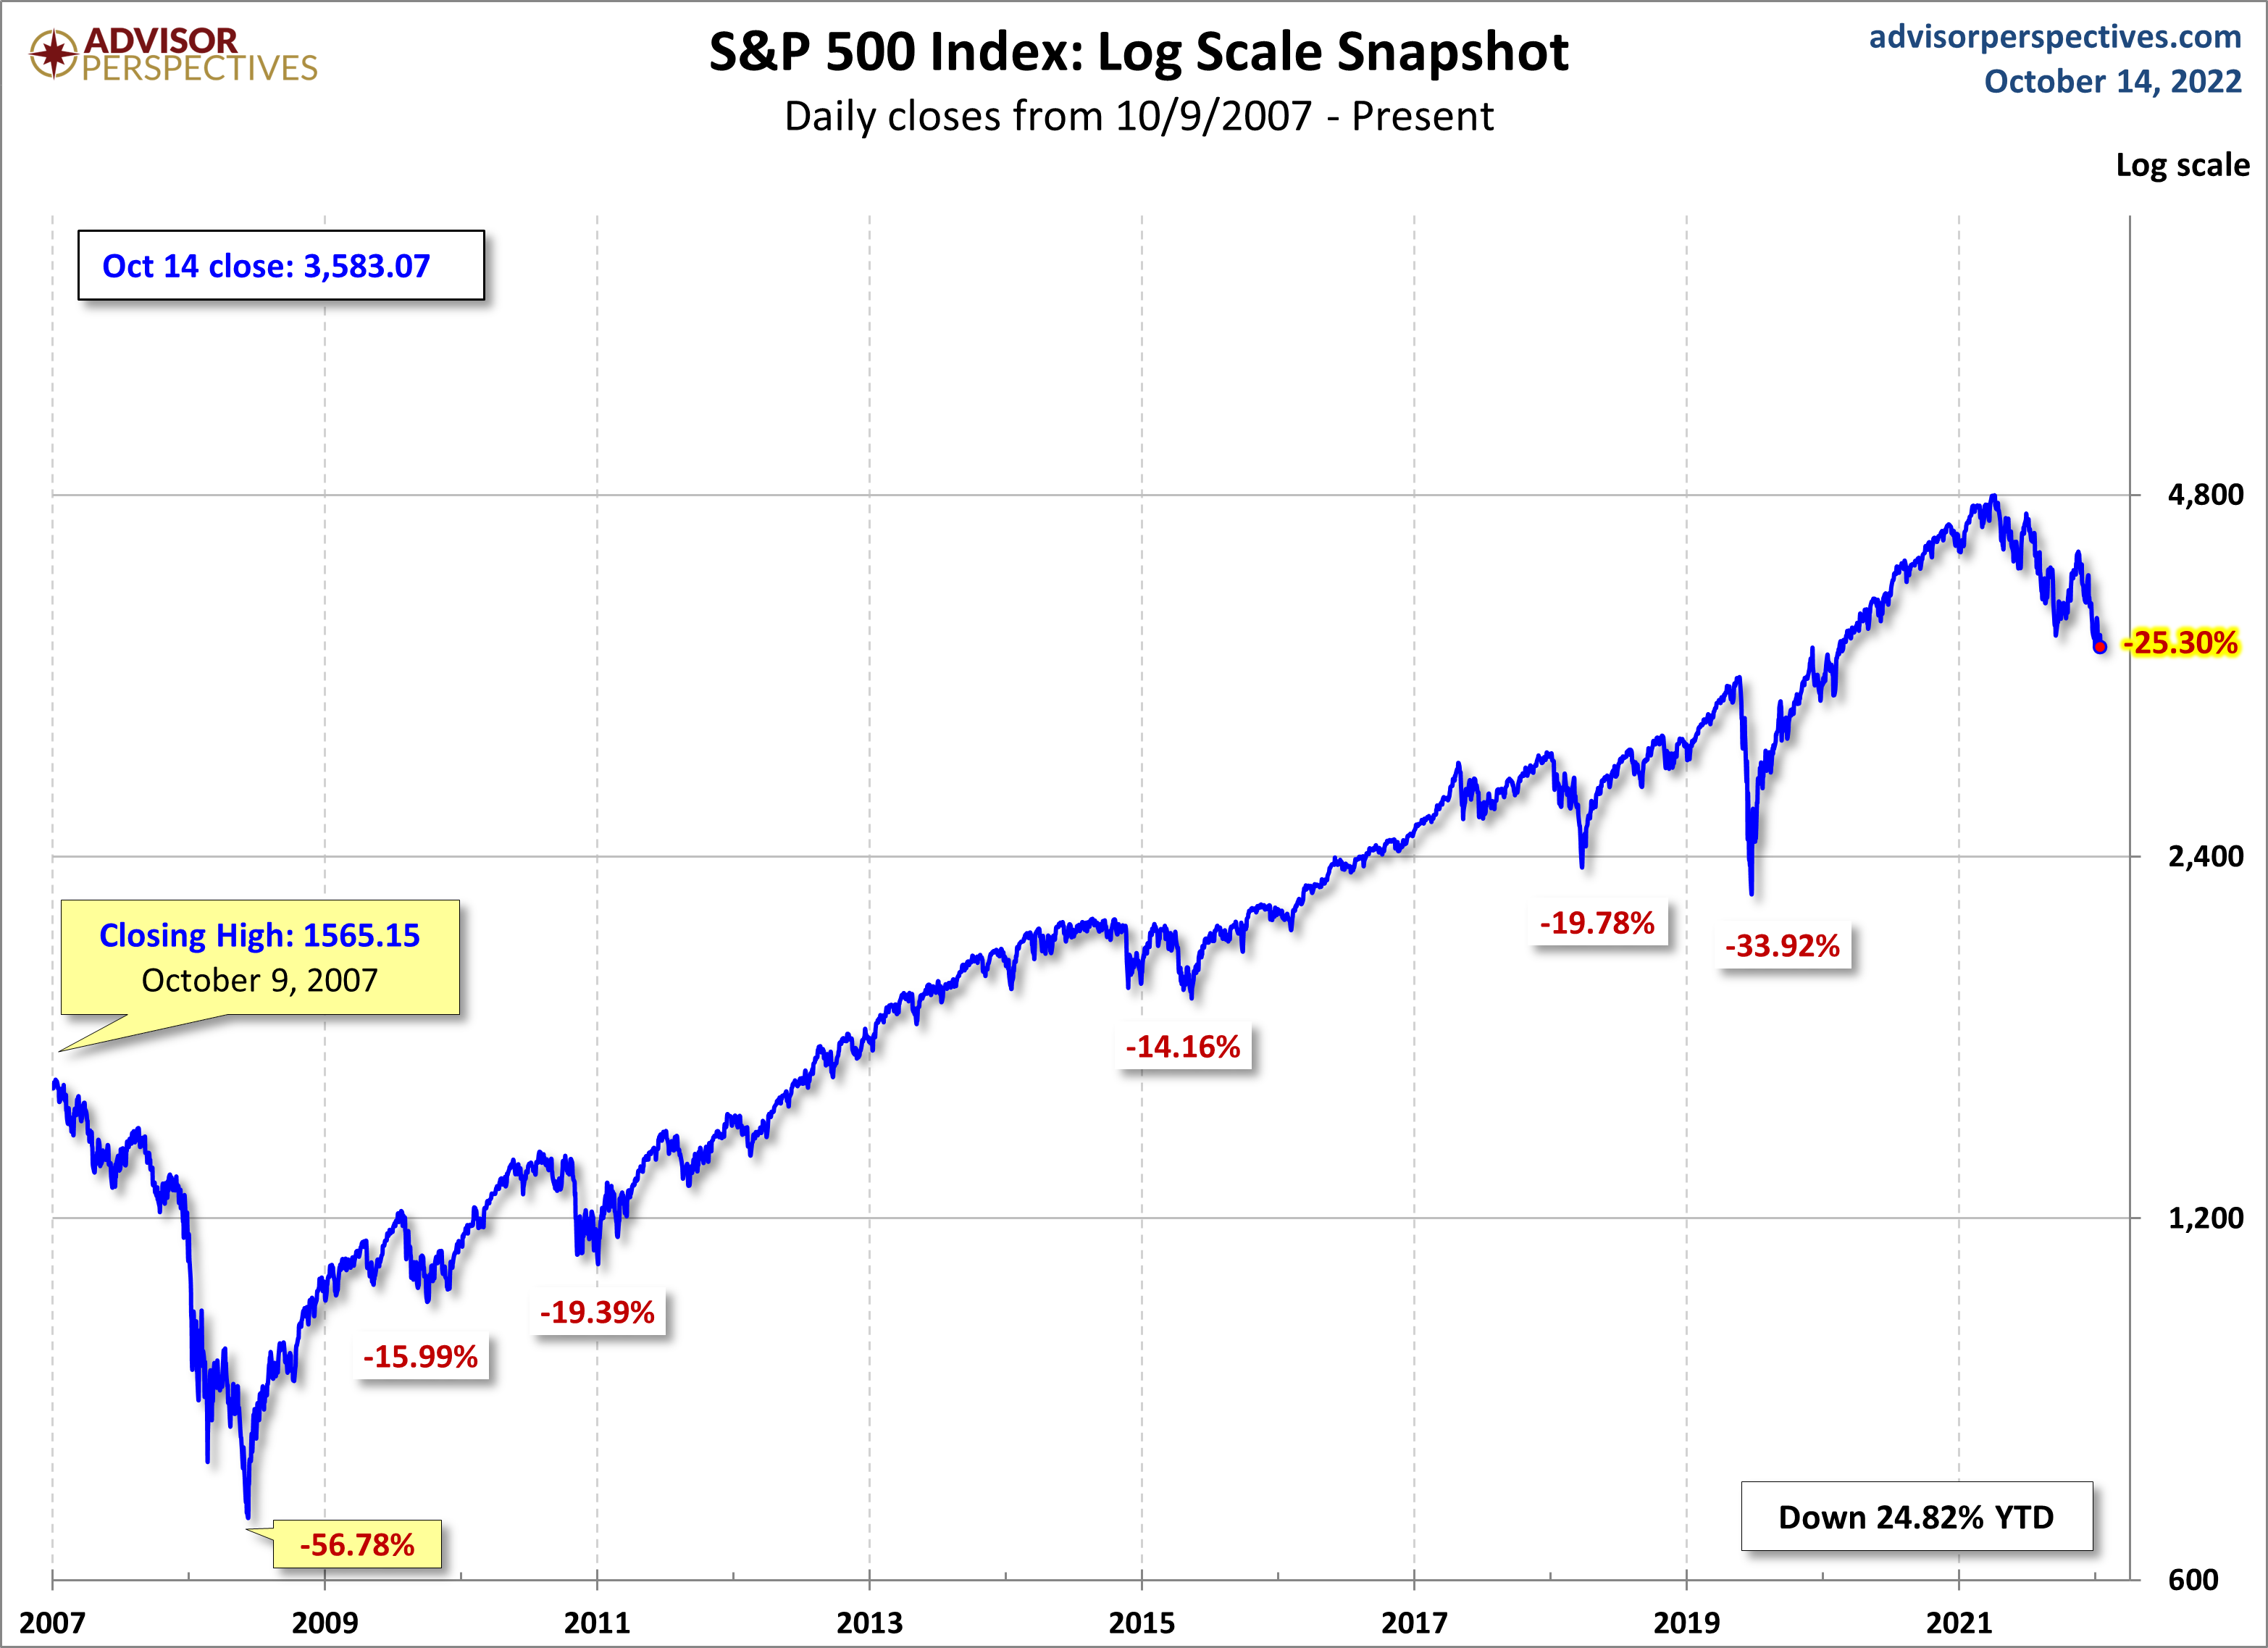
Here is a more conventional log-scale chart with drawdowns highlighted.
(Click on image to enlarge)
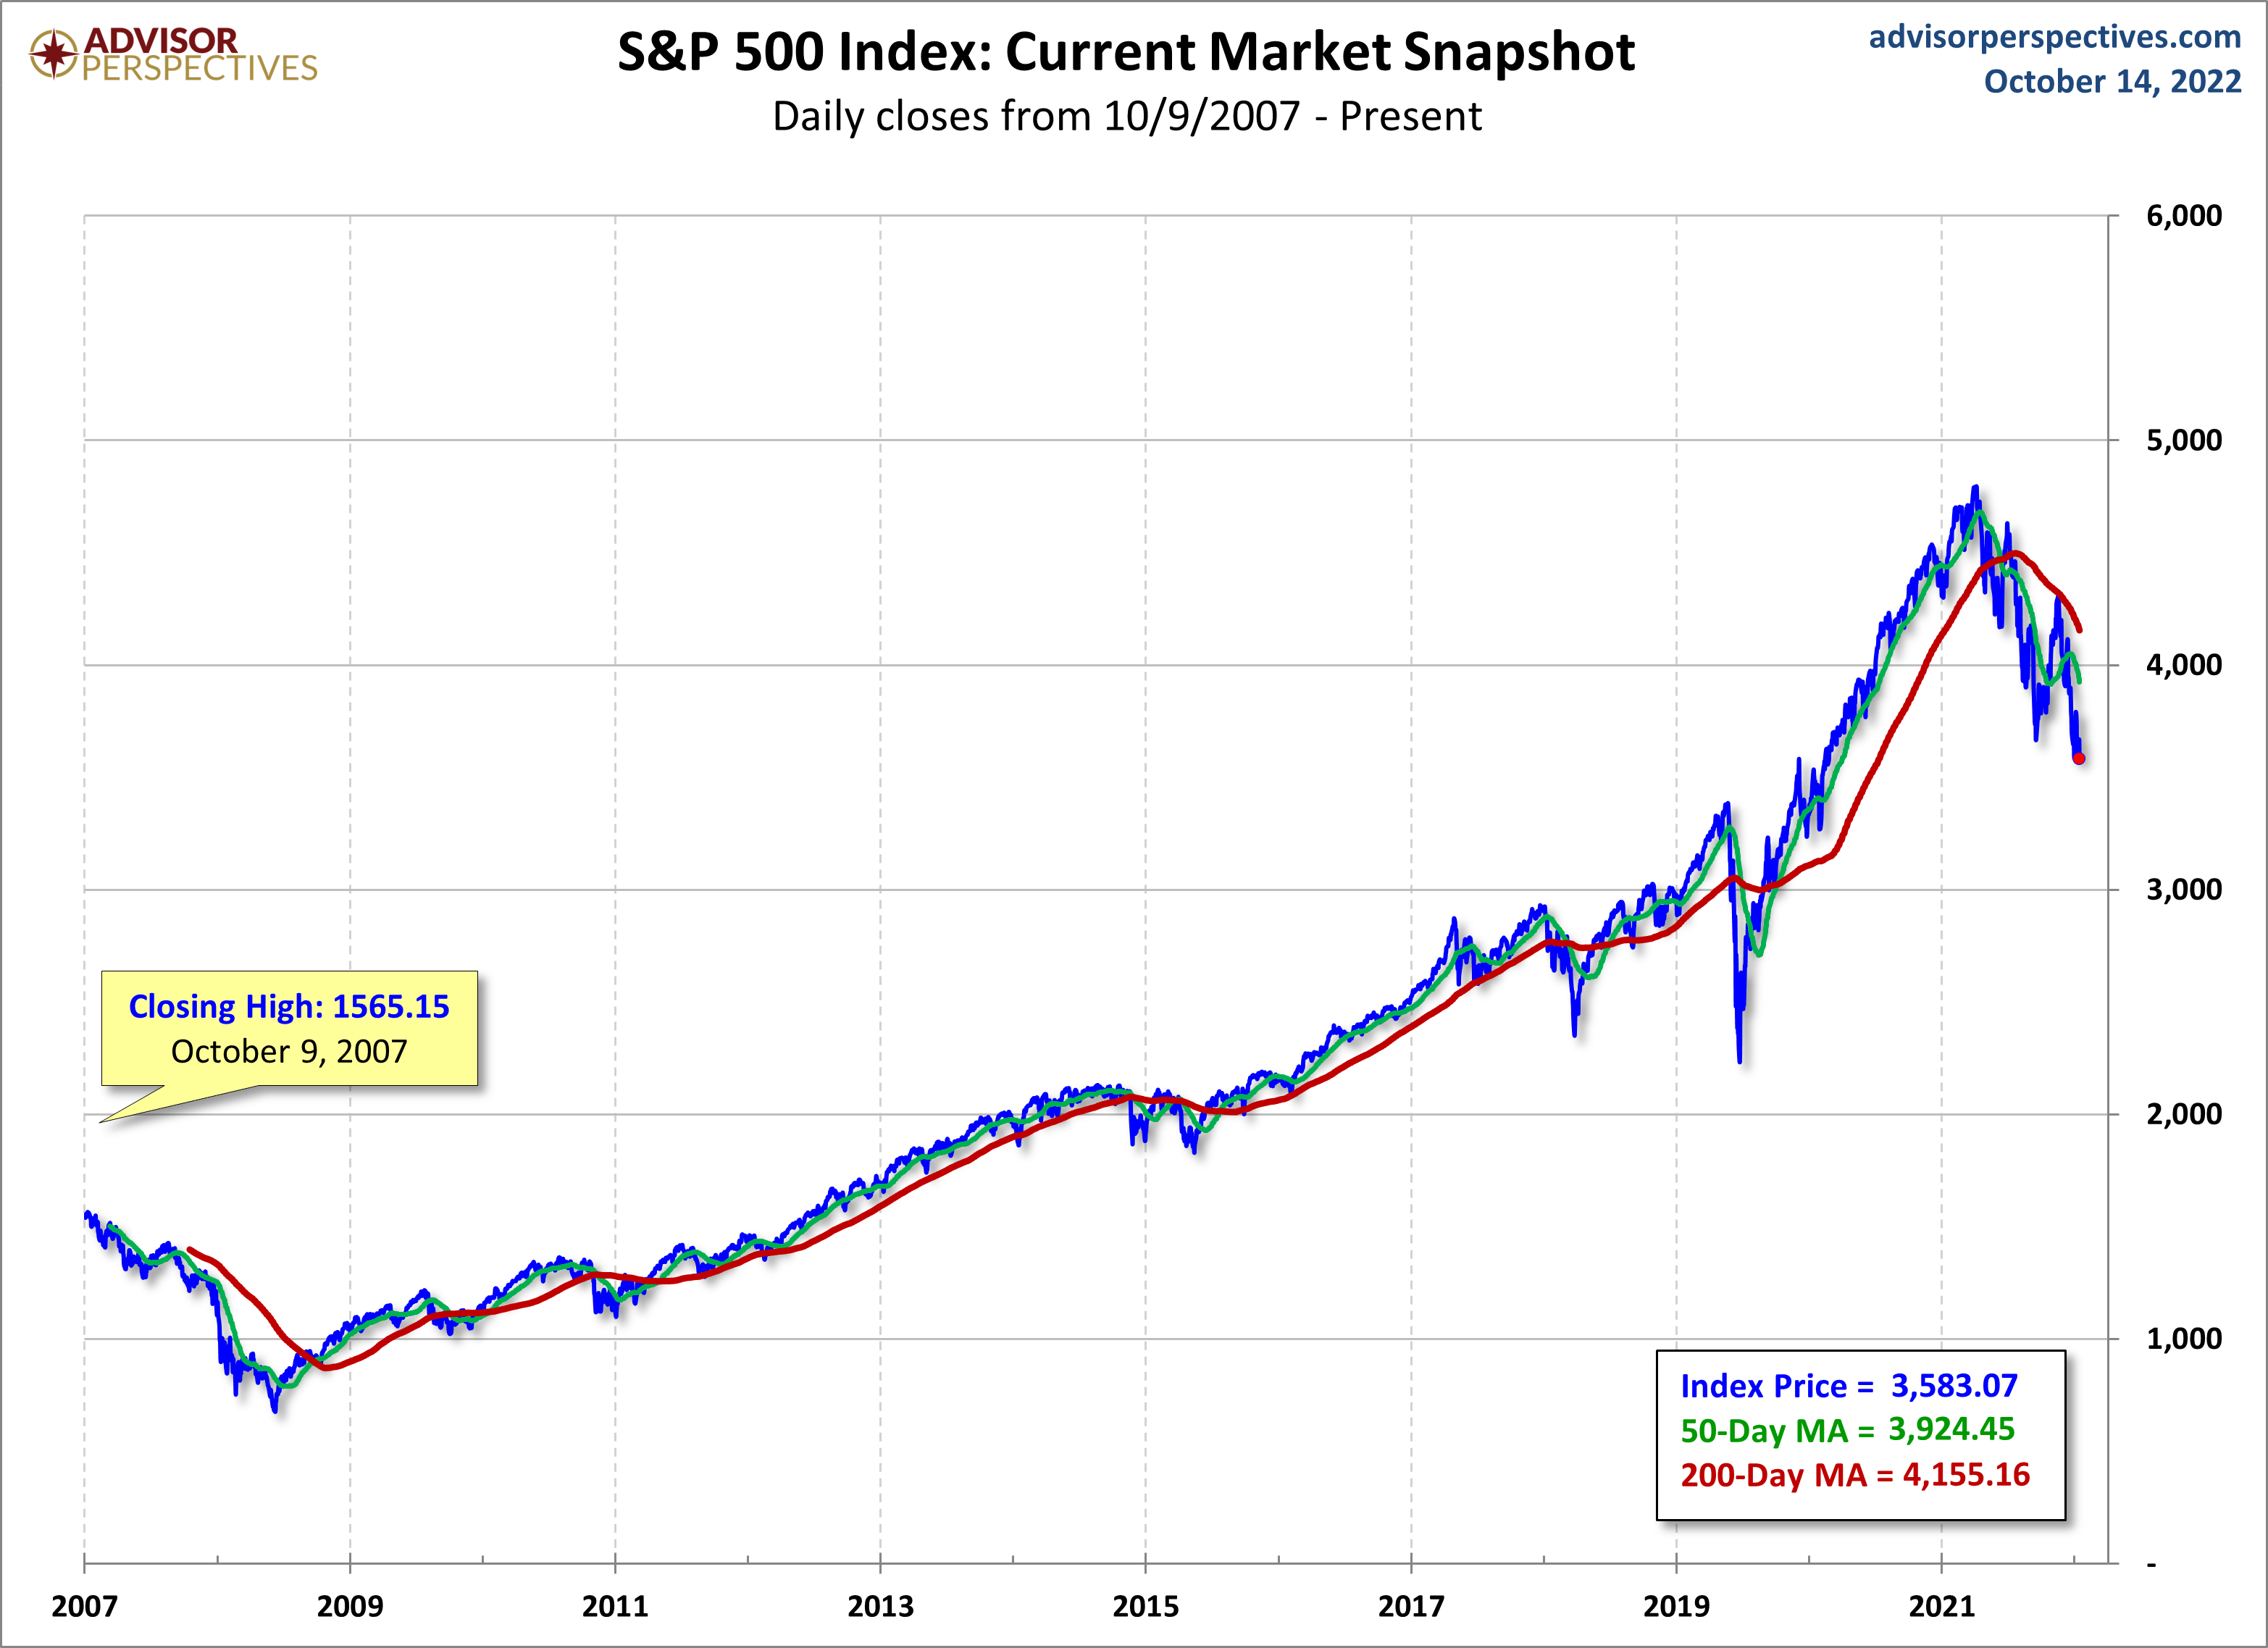
Here is a linear scale version of the same chart with the 50- and 200-day moving averages.
(Click on image to enlarge)
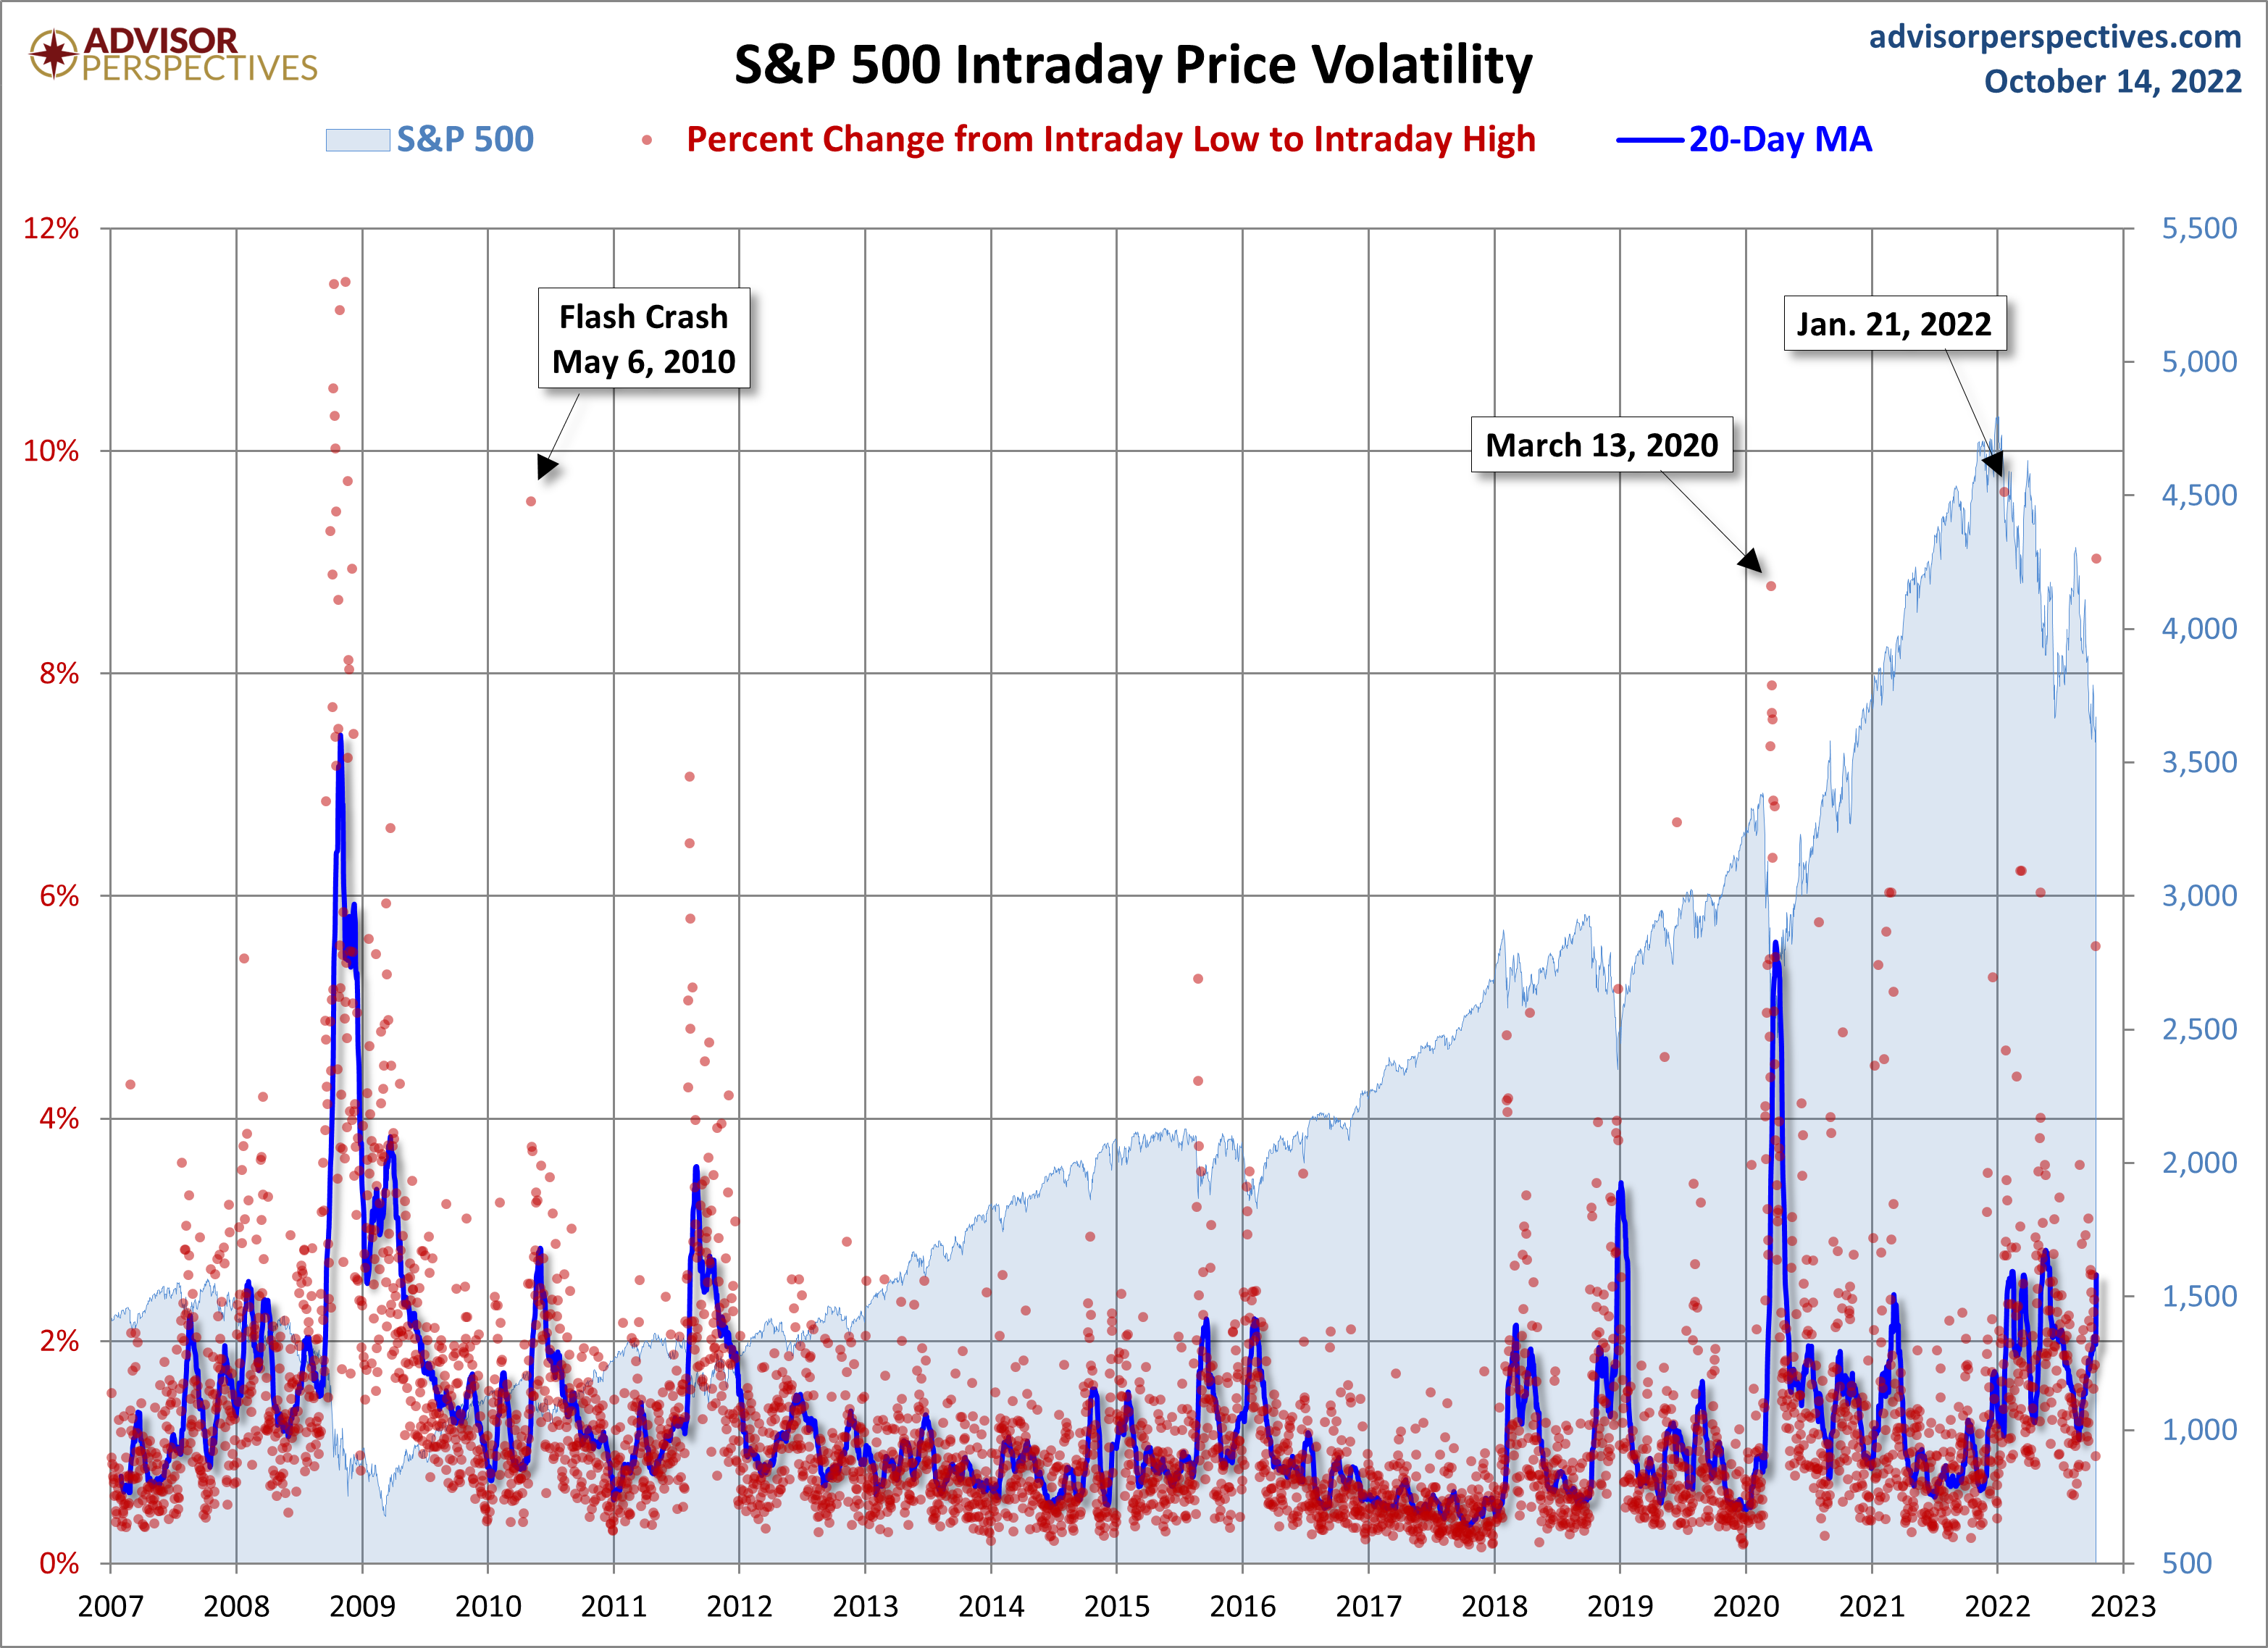
A Perspective on Volatility
For a sense of the correlation between the closing price and intraday volatility, the chart below overlays the S&P 500 since 2007 with the intraday price range. We've also included a 20-day moving average to help identify trends in volatility.
(Click on image to enlarge)
More By This Author:
The Big Four: September Real Retail Sales Inches Down
Treasury Snapshot: 2-10 Spread At -0.48%
Michigan Consumer Sentiment Inches Up In October


Comments
Log in or sign up to join the conversation.