
S&P 500 Rises On Rising Probability Of 2020-Q1 Rate Cut
Two weeks ago, the S&P 500 (Index: SPX) fell because investors believed the prospect of the Fed cutting rates in the first quarter of 2020 had been taken off the table as the chances the Fed would cut rates during the fourth quarter of the current year became an even money bet.
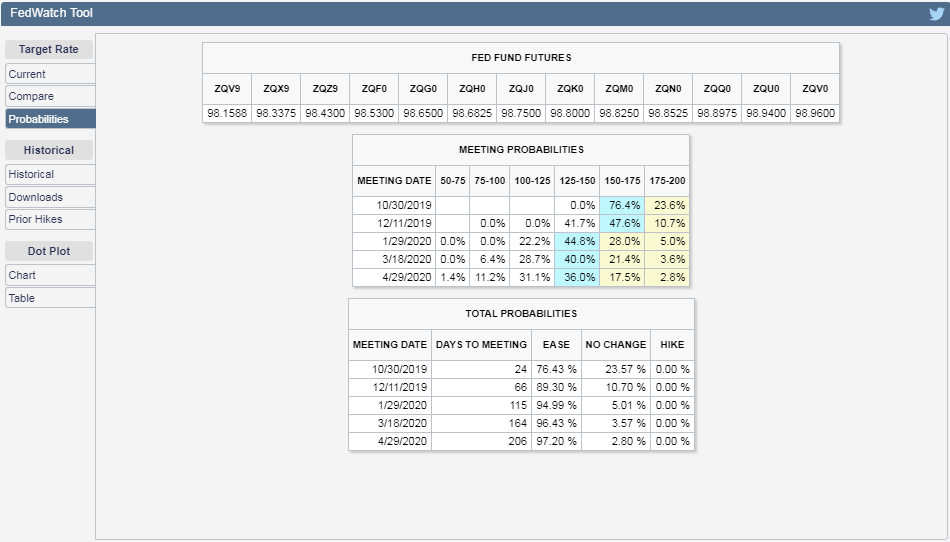
What a difference a week makes. By the end of the first week of October 2019, not only had the odds of a quarter point rate cut in 2019-Q4 almost been locked in, the probability of another quarter point rate cut in 2020-Q1 was back in play. Here's a snapshot of those rate cut probabilities as given by the CME Group's FedWatch Tool at the close of trading on Friday, 4 October 2019:
(Click on image to enlarge)
Given the math behind how stock prices work, that shift in the forward-looking focus of investors was accompanied by a rebound in stock prices off their lows for the week.
(Click on image to enlarge)

We find the level of the S&P 500 is now consistent with investors splitting their attention between 2019-Q4 and 2020-Q1, as hypothesized. In the chart above, the level of the S&P 500 is close to the trajectory coinciding with investors focusing on 2020-Q3, but we find no evidence in the flow of news for the week that investors are focusing any part of their attention on that very distant future quarter. Logically, because investors have been alternately shifting their attention back and forth between 2019-Q4 and 2020-Q1 during 2019-Q3, in the absence of any evidence supporting a shift in focus toward 2020-Q3, it makes more sense that the shifts between 2019-Q4 and 2020-Q1 has continued.
It certainly isn't for a lack of looking for evidence supporting a shift in attention toward 2020-Q3 on our part. Here are the market moving headlines we identified during the first week of October 2019, where we find lots of evidence in support of the investors looking at either 2019-Q4 or 2020-Q1, but not any further into the future.
Monday, 30 September 2019
- Oil drops more than 1% on trade war jitters and Chinese data
- Bigger trouble developing in China all over:
- Signs of China's stimulus gaining traction:
- China September factory activity surprises, expands fastest in 19 months: Caixin PM - "19 months" refers back to March 2018, which was Month 0 for the U.S.-China tariff war.
- White House trade adviser Navarro calls China delisting report 'fake news': CNBC
- Apple and Merck drive Wall Street higher as trade worries abate
Tuesday, 1 October 2019
- Oil prices sink as weak U.S. economic data dims demand outlook
- Bigger trouble developing in China all over:
- U.S. factory activity sinks to 10-year low in September
- Canada's GDP flat in July as oil and gas extraction shrinks
- Mexican manufacturing declines for fourth straight month
- Euro zone factory activity shrank for eighth month in September - PMI
- Swedish manufacturers catch German cold as global woes hit home
- French manufacturing activity dipped in September - PMI
- South Korea September factory activity contracts for fifth month; rate cut may be needed soon: PMI
- Japan September factory activity shrinks most since Feb as orders slump: PMI
- Bigger stimulus developing all over:
- Fed minion ignores global gloom:
- Wall Street tumbles as factory activity hits 10-year low
Wednesday, 2 October 2019
- Oil slides 2% as U.S. inventories build, weak economic data weighs
- U.S. private payrolls growth cools in September: ADP
- Bigger trouble developing in the Eurozone:
- Bigger stimulus developing in China in India:
- Wall Street falls as U.S. data stokes economic worries
Thursday, 3 October 2019
- Oil ends little changed after touching near two-month lows
- Bigger trouble developing in China in the Eurozone:
- Bigger trouble developing in China in the U.S.:
- Fed minions running around in different directions:
- Trump says Chinese delegation coming to U.S. next week for trade talks
- Stocks climb as soft data fuels rate cut hopes
Friday, 4 October 2019
- Oil settles up as U.S. unemployment rate drops, but crude ends week down 5%
- U.S. unemployment rate hits 3.5%; job growth moderate
- Fed's Powell repeats U.S. economy "in a good place"
- Wall St. rallies in wake of payrolls report
Elsewhere, Barry Ritholtz extracted six positives and six negatives from the past week's economics and market-related news, where unicorns made both sides of the ledger!
As a bonus, Barry also interviewed Robert Shiller for his Masters In Business podcast on Bloomberg, where he cited Shiller's seminal 1981 paper "Do Stock Prices Move Too Much to Be Justified by Subsequent Changes in Dividends?". It's pretty amazing how far we've come in the last 38 years, where in 1981, Shiller didn't have access to dividend futures and thus couldn't quantify the volatility that arises from investors rationally shifting the time horizon in which they make their current day investing decisions between different points of time in the future, which to Shiller, seemed like irrational behavior.
Next week, we'll roll our spaghetti forecast chart of the quantum trajectories the S&P 500 might take depending upon which point in the future investors fix their attention upon forward through the end of the fourth quarter of 2019. For this edition of our S&P 500 chaos series, it made sense to look backward at 2019-Q3 one last time....
Disclaimer: Materials that are published by Political Calculations can provide visitors with free information and insights regarding the incentives created by the laws and policies described. ...
more

