
S&P 500 Remains On The Front Foot

Image Source: Unsplash
US markets pushed higher after the open, tracking a firmer risk tone observed elsewhere across financial markets with European stocks, cryptocurrencies and copper all pushing higher. In this mostly technically focused S&P 500 article, I am highlighting the upside potential of the US benchmark index, where I think hitting a new all-time high might be just a matter of time, with a potential for an extension to the next big level of 7,000 – barring a major setback in US-China trade talks.
Earnings continue to roll in
Investors have been keeping an eye on the latest batch of third-quarter earnings, which have largely been positive although the latest results from the likes of IBM, Netflix and Germany’s SAP have disappointed. But Nokia and luxury giant Kering impressed with their results. T-Mobile, Blackstone, and Intel, all due to report later today. So far, the earnings season has been broadly supportive for equities, offering some relief against a backdrop of macroeconomic jitters and trade tensions. Check out the biggest stock gainers today to get a good idea of what’s moving and what’s not.
Why other factors are pushing stocks higher?
The major indices hovered just below record highs, shrugging off a mixed set of US and European earnings today in what has otherwise been a rather good earnings season for the S&P 500 companies thus far. The real headline, however, came from the oil market, as crude prices surged to a two-week high following fresh US sanctions on Russia’s largest producers. The jump in oil prices lifted energy names like BP and Shell, helping to nudge the FTSE 100 to a new record high. Will we see new records on Wall Street? For now, hopes for interest rate cuts continue to underpin the S&P 500 outlook, even as renewed uncertainty around US-China trade relations keeps a lid on broader enthusiasm. Washington’s latest suggestion that it might restrict software exports to China threatens to reignite tensions, but upbeat comments from Trump this week have helped temper those fears. Traders are now watching Friday’s delayed US inflation print closely for fresh clues on the Federal Reserve’s next move. So far, expectations of two more cuts this year has helped to provide support for stocks.
Keep an eye on crude oil
The overnight story was undoubtedly oil. Prices extended their rally after President Trump announced sanctions against major Russian oil firms — a move that lifted WTI by about $5+ from last week’s multi-month low near $60 a barrel. Interestingly, this has yet to dent overall risk appetite. US equity futures remain higher, and even cryptocurrencies have joined the rebound.
Whether these sanctions meaningfully disrupt Russian oil flows — and in turn justify such a sharp jump in prices — remains to be seen. For now, the reaction appears contained to the energy market rather than spilling over into broader financial risk sentiment.
Technical analysis and key levels to watch
From a technical perspective, the S&P 500 chart remains in a bullish trend. After that sharp 2.5% drop in the first week of October, the index slipped below a couple of short-term moving averages and support levels, luring in short sellers. But the quick rebound that followed last week was a good reminder of a classic market truth — the trend is still your friend. So far this week, we have seen some more volatility but the index was still holding in the positive territory and above some of those reclaimed levels and moving averages that it had temporarily broken earlier this month. Thus, the bullish trend is intact despite some choppy trading this week.
Indeed, the S&P and other US – and indeed, global – indices continue to make higher highs and higher lows — a clear sign the uptrend remains intact. A true reversal would need a decisive break below key support levels and a confirmed topping pattern, neither of which we’ve seen yet. With that in mind, dip-buying continues to rule, even at these levels.
(Click on image to enlarge)
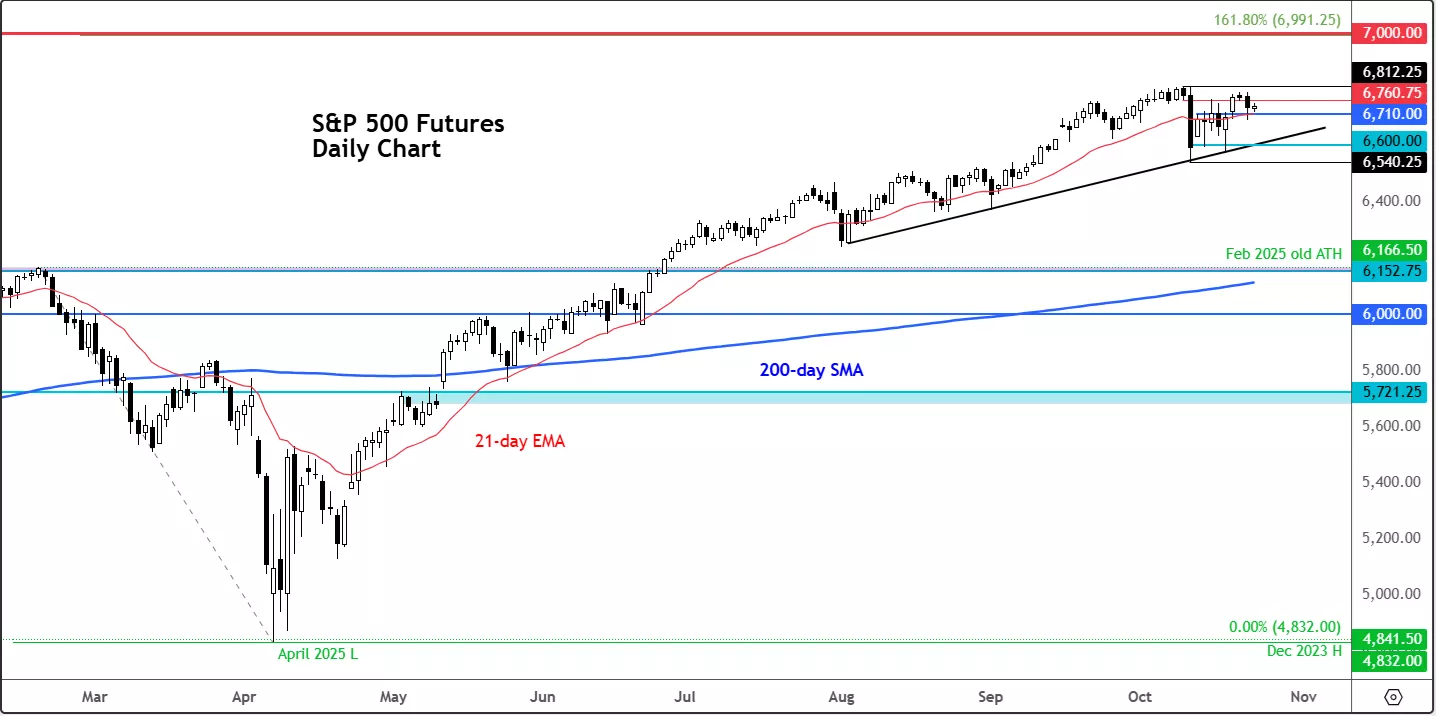
For now, immediate support sits around 6,700–6,710 on the S&P 500 futures chart — roughly in line with a couple of daily highs and closes from the previous week, and the 21-day exponential moving average. Below these levels, you have a short-term trend line coming in around 6,600-6,610 area. Finally, this month’s low comes in at 6540, where many stop orders are likely parked.
On the upside, initial resistance comes in near 6760, which was a prior support and resistance level and Tuesday’s low. A clear move above this level would bring the all-time high at 6812 back into view, followed by the round 6900 level and the big 7000 mark beyond that.
More By This Author:
GBP/USD Hit By Soft UK Data Ahead Of US CPI And FOMC Next WeekUSD/JPY In Focus As Powell’s Dovish Tone Adds To US-China Tensions
S&P 500 Analysis: More Highs Ahead Of Earnings


