S&P 500, Nasdaq 100 Price Outlook For The Week Ahead
The latest US Jobs Report has put the brakes on US equities with the release showing an unexpected surge in hiring. A bumper 528k new jobs were created in July, pushing the unemployment rate down to 3.5%, the lowest level since February 2020.

Friday’s labor report has now pushed back all thoughts of the Fed slowing down the pace of interest rate hikes as the central bank continues to target stubbornly high inflation. Recent talk of a Fed pivot on rates, due to a weakening economy, is not borne out by the latest NFP report which shows the US jobs market in rude health. While today’s release will allow the Fed more flexibility to hike rates higher and faster, it is only one data point. A look at the US Treasury market shows the UST2s/10s curve inverting further, now around -40bps, and this continues to point to a recession in the US, despite the semantics used by the Fed to say all is ok. As always, data releases remain key, while Fed chatter also needs to be closely listened to.
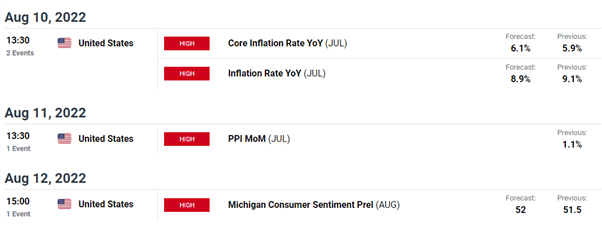
Next week, all eyes will be on Wednesday’s inflation report with core inflation expected to tick higher again. If this report shows inflation falling, however, it may fuel thoughts of a ‘soft landing’ in the US, a goldilocks moment for the Federal Reserve.

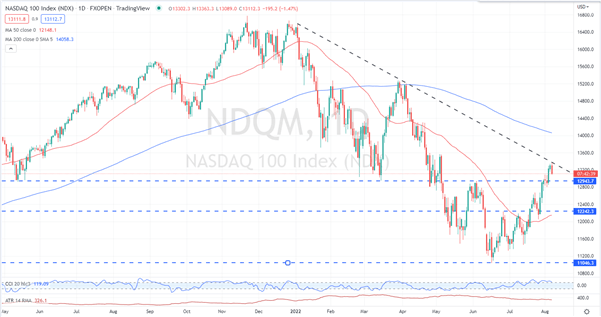
The recent rally in the Nasdaq 100 has tested and failed its first attempt to break trend resistance off the late-December 2021 high. The tech-heavy indices has been on a surge of late, rallying over 20% off the June 16 low. The recent ‘buy the dip’ mentality over the last six weeks looks like it may be finished for now and traders may soon change over to ‘sell the rally’ mode that served them so well since the end of 2021.
Nasdaq 100 Daily Price Chart – August 5, 2022

Chart via TradingView
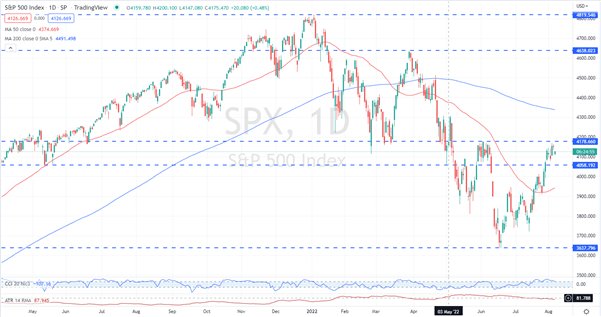
The S&P 500 rally has also been bought to a halt after making a fresh two-month high this week. The indices has printed a sequence of higher lows over the last 6-8 weeks, and while the S&P 500 will remain under pressure, the downside for the indices will likely be more limited than the tech-heavy Nasdaq.
S&P 500 Daily Price Chart – August 5, 2022

Chart via TradingView
Retail trader data show 37.63% of traders are net-long with the ratio of traders short to long at 1.66 to 1. The number of traders net-long is 3.09% higher than yesterday and 0.15% lower from last week, while the number of traders net-short is 0.77% higher than yesterday and 17.15% higher from last week.
We typically take a contrarian view to crowd sentiment, and the fact traders are net-short suggests US 500 prices may continue to rise. Positioning is less net-short than yesterday but more net-short from last week. The combination of current sentiment and recent changes gives us a further mixed US 500 trading bias.
More By This Author:
British Pound (GBP/USD) Forecast – Will the BoE Go Hard This Thursday?
British Pound Latest – GBP/USD Pushing Higher On US Dollar Weakness
USD/JPY Slumps Into Support, Fed May Slow Pace Of Rate Hikes
Disclosure: See the full disclosure for DailyFX here.


