
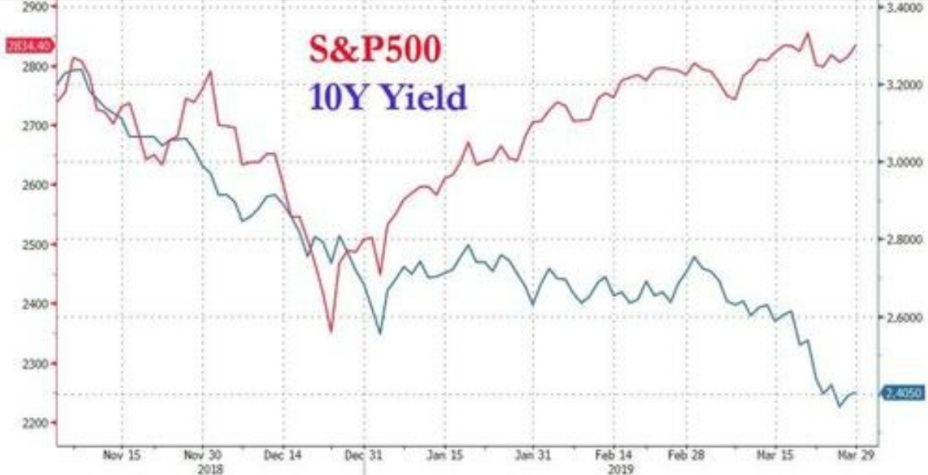
Did anything change during the trading week to reinforce a bullish outlook on both the economy and equity market for 2019? That’s the question we should all be considering, given the S&P 500 (SPX) is only 1.5% off its all-time trading high level. The benchmark index has rallied roughly 23% from its December 2018 lows and has finished higher for 2 consecutive weeks, gaining roughly 2% this past week. And all this with a continuous bid in the Treasury markets, forcing yields lower. The chart below depicts the alligator jaws that permabears are insisting will close shut sooner or later and with the S&P 500 falling.
To answer the question positioned earlier, the answer is no! I remain constructive on both the economic cycle and the market. While I wouldn’t be surprised when the S&P 500 does take a breather and retrace somewhat, the impetus to buy any pullback of consequence is building. It is building for a plethora of reasons, but most importantly in congruence with improving economic data.
S&P 500 2,900
Last week’s weekly expected move for the S&P 500 was $37/points and this was achieved by Tuesday of the trading week. By the completion of the trading week, the S&P 500 finished outside of the weekly expected move, with volatility further declining. The VIX closed at 12.82 for the week, down more than 6 percent.
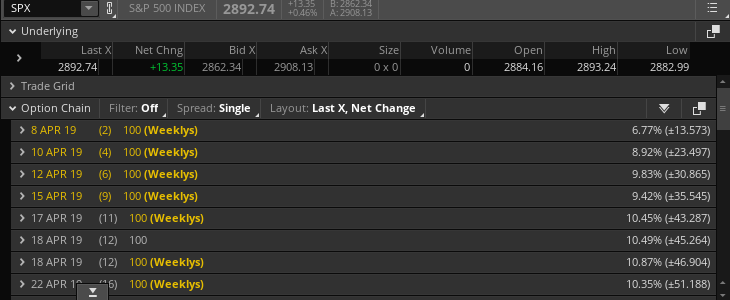
As displayed in the screenshot above and in keeping with a decline in implied volatility WoW, the S&P 500 weekly expected move for this coming week is roughly $31/points.
So far, there has only been one week in 2019 where the S&P 500 retraced by just over 2 percent. As of Friday’s close, the S&P 500 has gone 69 days without a 3% sell-off.
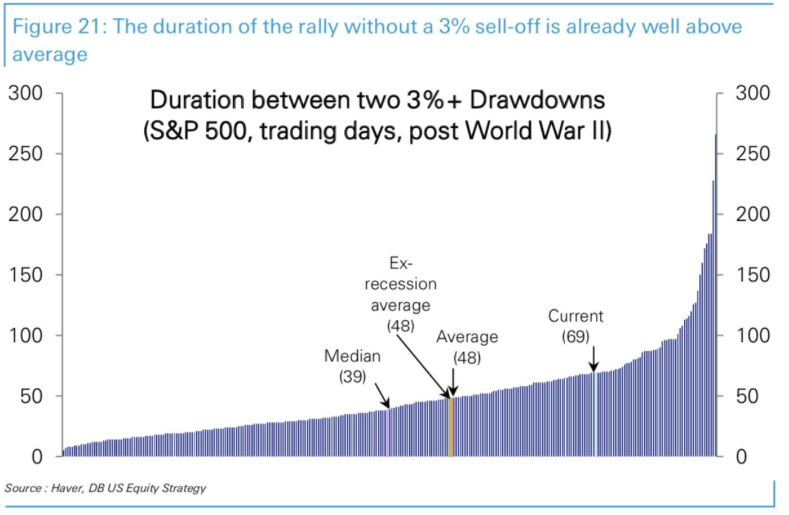
The chart above suggests the current streak without a 3% pullback is well above average. It’s well above average duration between 3% pullbacks is due to the Breadth Breakaway and Zweig Thrusts experienced earlier this year, which found capital forced into equities even with light leveraging that has since followed. Remarkable!
Additionally, one would think that the Relative Strength Index (RSI) might be expressing extreme levels, given the constant upward movement of the S&P 500 and its index ETF partner (SPY ), but that only became a consideration as of last Friday.
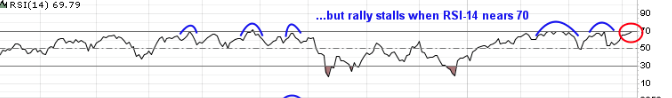
The S&P 500 14-day RSI had just entered the 60s late Thursday. I wouldn’t become concerned about overly exuberant sentiment and upward movement in the S&P 500 until the index expresses a 14-day RSI in the low 70s, with respect to the YTD rally. We may very well see the index achieve such an RSI level as soon as Monday. Point of consideration: That may also coincide with the SPX hitting that all-too-important 2,900 level.
Fund Flows Still Stink, But May Improve
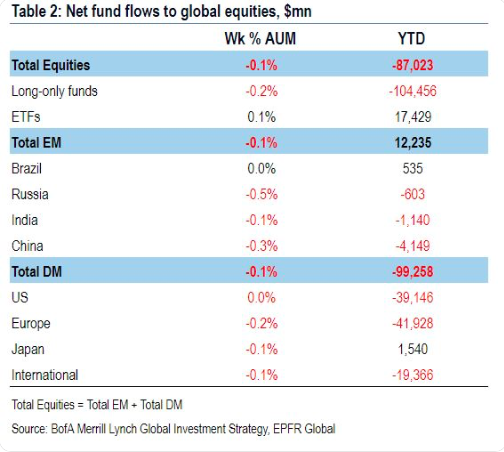
One of the more astounding and confounding aspects to the remarkable YTD market rally is that it has come with net equity ETF outflows. Money continues to poor out of equities and into bonds, but still, the market has trended higher. Citing data from J.P. Morgan Chase's (JPM) prime brokerage group, at the end of March, hedge fund net exposure as measured by the ratio of bullish bets to bearish ones stood near the lowest level in more than a year.

According to Hedge Fund Research, funds have climbed 4.9% in 2019 according to the Bloomberg Hedge Fund Database, rebounding sharply from the previous three months, largely thanks to beta chasing buoyant equity markets. The results are multiples better than the 2018 results, but when compared to the benchmark S&P 500, which is up more than 15% YTD, hedge funds are once again underperforming by multiples.
So with YTD outflows, the question begs to be asked: Who is buying this market, producing this remarkable, flow-less rally of consequence? Jared Woodward investment strategist at Bank of America Merrill Lynch said although it isn’t unprecedented for equity fund flows to be negative while stock prices climbed, the pace and magnitude of the stock market’s rise and equity outflows are much greater so far this year. Back in 2016, equity outflows totaled $93 billion, but the accompanying 5% rise in global stocks was far less potent than this current period, the analysts said.
What we know is that there are 3-4 main components executing the market’s confounding rally.
- Corporate buybacks
- Light re-leveraging
- Dealer gamma imbalance forcing buying underlying stock.
- Short covering
S&P 500 firms have repurchased $227 billion of their own stock in the first quarter of 2019, according to FactSet data, up from $143 billion in the first quarter of 2018. Coupled with corporate buybacks is the notable light re-leveraging amongst fund managers and pension funds. And then there is the nasty element that reversed course from late 2018 and as the calendar year turned. U.S. index delta-adjusted open interest is now $446bn vs. -$1.2tn at the Dec'18 lows, and $916bn at Jan'18 highs). This is the gamma imbalance, where the higher the market rises, the more dealers are forced to buy. It’s not short covering to be clear, but rather quant weighted market balancing. Additionally, it doesn’t require a new seller to produce a buyer. This is an important point in the gamma imbalance that goes overlooked. Recall that during the Q4 2018 period, for such severe market moves lower and daily, the selling pressure was very light, just as it is today as the market rallies and volume has only become lighter as the rally has carried onward to-date. Yousef Abbasi, director of U.S. institutional equities and global market strategist at INTL FCStone said volumes are running 15% below the average, even on big data days.
So with all the negatives surrounding the market’s YTD rally, one that has been met with substantial outflows and increasingly light volume, equity ETF flows were actually positive last week. The ETF universe experienced net positive flows of $7.2 billion for the week. Equity ETFs (+$4.5 billion) and taxable bond ETFs (+$2.8 billion) were responsible for the net inflows, while muni debt ETFs saw $73 million leave their coffers. For equity ETFs, the largest individual net inflows belonged to SPDR S&P 500 ETF (SPY, +$2.9 billion) and iShares Core S&P 500 ETF (IVV, +$1.4 billion), while Invesco QQQ Trust (QQQ, -$1.1 billion) had the largest net outflow. For taxable bond ETFs, iShares iBoxx $High Yield Corporate Bond ETF (HYG, +$912 million) had the largest net positive flow, while iShares Floating Rate Bond ETF (FLOT, -$255 million) saw the most money leave.

While Equity ETF’s had a positive week, Equity Mutual funds didn’t fare quite as well.
Economy Slowing to Trend-Growth
Since the Q4 2018 period expressed a slowing from the “sugar highs” of the Q2-Q3 periods, I have been of the opinion that slowing growth was inevitable and recessionary conditions weren’t present or even probable near-term. In short, the most likely economic growth outcome was a resumption of trend-growth. Trend-growth is an economy that expresses GDP from 1.75%-2.5%, depending on whom one asks.
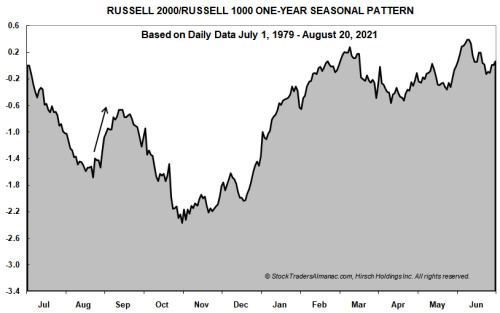
For the Q1 2019 period, the range of forecasts for GDP are quite wide but found narrowing and above 1.4% by and large. Fears of a recession tend to coincide or commence around the Q1 period, always. This is largely a seasonal factor and one that we can validate. Between 1986 and 2015, real GDP growth for Q1 averaged 1.78% compared to 2.86% across Q2, Q3, and Q4.
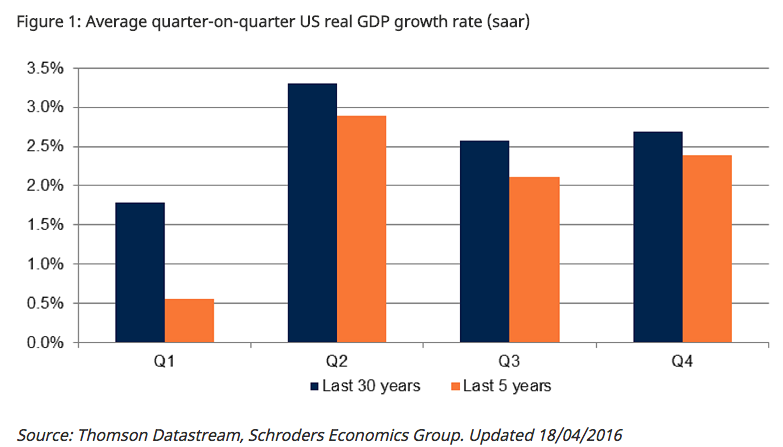
While the above study ends in 2015, we can see the same pattern since that time in the following chart:
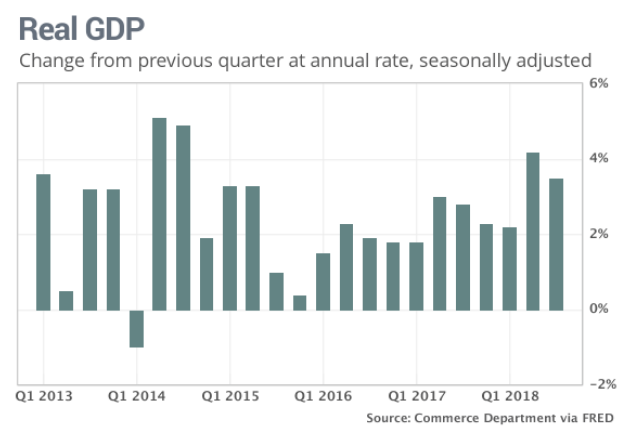
From 2016-2018, all Q1s were the weakest of the calendar year, which by current accounts appears to be a trend that will continue in 2019. Such a statement is, of course, subject to many macro and micro-factors that will play out in 2019. So let’s take a look at some of those macro-economic factors that surround and underpin the U.S. economy.
This past week was a critical week for not just the S&P 500’s rally, but the economic outlook that will fuel corporate earnings going forward. The weekly economic data kicked into high gear on Monday with retail sales that were underwhelming but came with a significant upward revision to the January retail sales (+.7%). As such, the February -.2% decline in MoM retail sales was brushed off in favor of the January revision and a 2.2% YoY increase for February. Shortly after retail sales were released, investors were able to rejoice in the ISM manufacturing data upside surprise.
When inventory levels are “too low”, orders start to flow and manufacturing ultimately ticks higher. This was what I forecasted back in early March and the ISM manufacturing index did not disappoint, climbing to 55.3% last month from 54.2% in February.

Durable goods orders declined in February and ISM non-manufacturing index slipped as well, but neither signal a recession and both are still expressing YoY growth. Here are some comments from within the ISM non-manufacturing index survey:
“From March ISM services: “April is when our real busy season begins and it has arrived early this year, demand is quite strong.” (Real Estate, Rental & Leasing). (2) Mortgage purchase apps are up 10% over the last year. Residential investment will lift GDP in '19.”
Rounding out the weekly data was an increase in Nonfarm Payrolls data. While the initial jobless claims levels support trend-growth statements and invalidate any fears of a recession on the near horizon, the latest Nonfarm Payroll data also supports a trend-growth forecast.
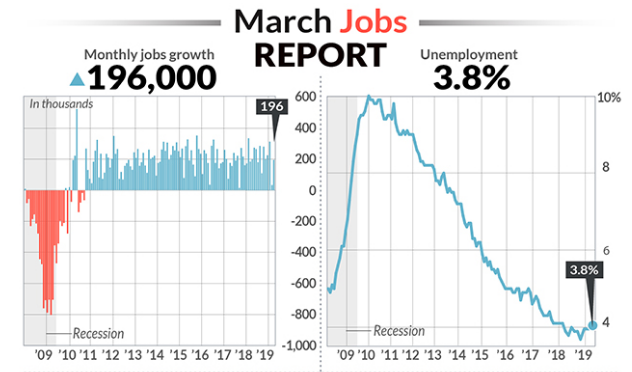
The U.S. created 196,000 new jobs last month after a swoon in February where job growth came in at a paltry 20,000. That number was revised slightly higher to 33,000. Additionally, wage growth slowed, easing any inflation fears that wage inflation would continue at its expansion-high pace witnessed in 2018. The amount of money the average worker earns rose 4 cents to $27.70 an hour last month. The increase in pay in the past 12 months slowed to 3.2% from 3.4 percent. Still, wages are rising near the fastest pace in a decade. Most economists think yearly pay will soon move closer to the 4% mark, underscoring just how tight the labor market has become.
Lastly and as I mentioned earlier, interest rates have been declining since November and with the 10-year yield declining from 3.25% last year to 2.35 recently, the 30-year fixed rate mortgage has decline from 4.95% in November 2018 to just over 4% presently.

This bodes well for the housing market, as we have recently witnessed a resurgence in New Home and Pending Home sales. Additionally, mortgage applications have risen for 3 consecutive weeks, with smaller loan sizes outpacing larger loans, possibly signaling first home buyers have moved on lower rates.
“Applications for smaller purchase loan sizes exceeded that of higher loan sizes — a positive sign that first-time buyers were increasingly active in the market,” said the Mortgage Bankers Association, which tracks weekly home loan applications, in a release.”
Taken as a whole, the more recent economic data sets don’t portend a recession any time soon. The weakness that pervaded the economy in 2018 to varying degrees were found in the interest rate sensitive sectors, auto, and housing sectors. But both sectors have more favorable conditions that serve to improve sentiment and sales for the sectors. And speaking of autos, they also surprised everyone with a strong monthly result in March.
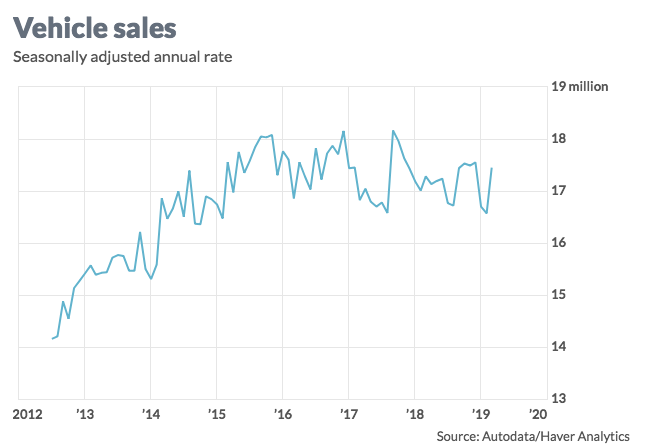
Motor vehicle sales reached a seasonally adjusted annual rate of 17.45 million in March, up from 16.57 million in February, according to data from Autodata. That’s the highest reading in three months and represents a recovery from a downbeat start to the year.
“The rebound in March puts sales in line with the average for [the fourth quarter], and suggests that consumption spending remains on track,” said Pooja Sriram of Barclays in a note to clients. The bank lifted its estimate of first-quarter GDP to 2.1% from 1.7%.”
Speaking of GDP forecast rising for the Q1 period, and as we round out this segment where we initially began, let’s take a look at what some of the latest GDP forecasts reveal.
- From Merrill Lynch:
We are tracking 1.9% qoq saar for 1Q GDP growth. Retail sales and capex data this week had little impact on tracking, while strong construction and inventory reports mostly offset consumption weakness at the end of the prior week. [April 5 estimate]
- From Goldman Sachs:
Our Q1 GDP tracking estimate rose by one-tenth to +1.5% (qoq ar). [April 5 estimate]
- From the NY Fed Nowcasting Report:
The New York Fed Staff Nowcast stands at 1.4% for 2019:Q1 and 1.9% for 2019:Q2 [Apr 5 estimate].
- From the Atlanta Fed GDPNow
Model estimate for real GDP growth (seasonally adjusted annual rate) in the first quarter of 2019 is 2.1 percent on April 2, unchanged from April 1.
And with respect to the economy, J.P. Morgan Chase recently upgraded their outlook for the Q1 period from 1.5% to 2% GDP growth. The firm believes the economy will achieve a smooth glide down from above-trend growth toward trend-growth in 2019.
“We reduced the probability of our base-case scenario of Above Trend Growth to 45% from 50%. We consequently raised the probability of Sub Trend Growth to 40% from 35%. It does appear as though the global economy will glide toward a soft landing with growth roughly at trend, perhaps a little bit above or below.
The outcome of the U.S.-China trade negotiations and Brexit will surely be important in determining which side of trend growth we will see.
We kept the probability of Recession unchanged at 10%. We do believe that the central banks have extended the cycle, and we don’t see recession as a 2019 or early 2020 event. The Fed’s preference for looking at average inflation through a cycle suggests that it is trying to protect against prematurely tightening, or over tightening, monetary policy. But we are late cycle, and a policy error, however minor, might be enough to bring forward that probability.
Finally, we kept the probability of Crisis at 5%. Geopolitics are a constant concern but, for now, cooler heads and rational thinking seem to be prevailing.”
The consensus among most institutions and economists is that the U.S. will experience a slowing of economic growth in 2019, but a recession is unlikely. For the week ahead, here is the economic data set for release.

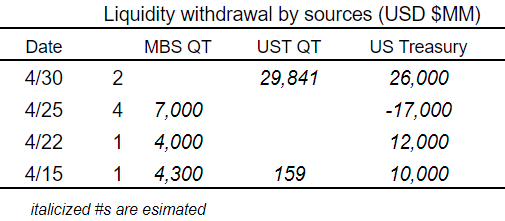
The JOLTS survey and FOMC are likely the key focus for the week. As the Fed remains sidelined for 2019, the minutes will be carefully combed over by economists and market participants alike. Quantitative Tightening is still in the cards until September and as such, April’s QT schedule is depicted below: (Barton Options)
Earnings Season Commences
For the coming week, 6 S&P 500 companies will be reporting earnings. While the number is low and the earnings season anticipation remains high, the projections continue to weaken for the period. There is an increasing probability that while earnings estimates have worsened this may be found in error. One of the worse performing sectors for the Q1 period is expected to come from the energy sector.
According to FactSet, the Energy sector has recorded the largest decrease in expected earnings growth since the start of the quarter (to -18.4% from 16.2%). Despite the decline in expected earnings, this sector has witnessed the third largest increase in price of all eleven sectors since December 31 at 15.6 percent. Overall, 26 of the 29 companies (90%) in the Energy sector have seen a decrease in their mean EPS estimate during this time. Of these 26 companies, 24 have recorded a decrease in their mean EPS estimate of more than 10%, led by Hess Corporation (to -$0.32 from -$0.02), Noble Energy (to -$0.03 from $0.16), and National Oilwell Varco (to -$0.01 from $0.07). However, Exxon Mobil (to $0.86 from $1.15) and Chevron (to $1.43 from $1.85) have been the largest contributors to the decrease in expected earnings for this sector since the start of the quarter. Both companies have witnessed double-digit increases in their stock prices since December 31.
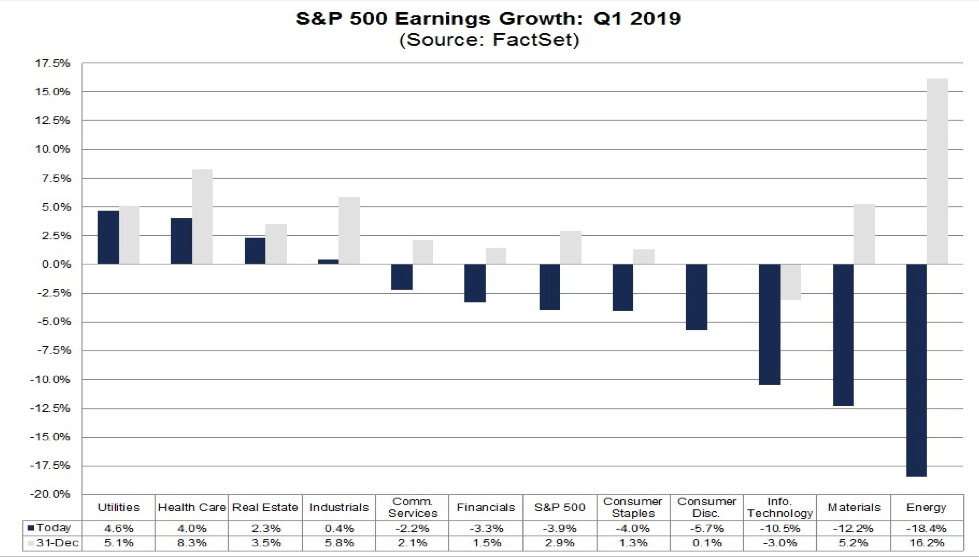
FactSet expects the Energy sector to express the greatest EPS decline within the S&P 500, even as crude oil prices have steadily climbed throughout the Q1 period and peaked last week above $63 a barrel.

FactSet has further reduced their projections for the Q1 period. FactSet now forecasts Q1 EPS to decline by -4.2% from -3.9% in the previous week. The firm has also reduced revenue expectations from 4.8% to 4.7% revenue growth for the period. Now let's look at Reuters Q1 2019 EPS forecast below.
Aggregate Estimates and Revisions
- First quarter earnings are expected to decrease 2.2% from 18Q1. Excluding the energy sector, the earnings growth estimate improves to -1.2%.
- Of the 23 companies in the S&P 500 that have reported earnings to date for 19Q1, 82.6% have reported earnings above analyst expectations. This is above the long-term average of 65% and below the average over the past four quarters of 76%.
- First quarter revenue is expected to increase 5.0% from 18Q1. Excluding the energy sector, the revenue growth estimate improves to 5.5%.
- 43.5% of companies have reported 19Q1 revenue above analyst expectations. This is below the long-term average of 60% and below the 67% prior four-quarter average.
- For 19Q1, there have been 85 negative EPS preannouncements issued by S&P 500 corporations compared to 31 positive, which results in an N/P ratio of 1.7 for the index.
- The forward four-quarter (19Q2 – 20Q1) P/E ratio for the S&P 500 is 16.6.
Investor Takeaways
The markets follow earnings over time, that’s how the markets work and have always worked. Certainly, in the interim, hiccups can occur in the market such as they did in Q4 2018, but as time progresses and earnings remain with FY19 expected growth, the S&P 500 and its peer indices have quickly corrected from the declines in 2018.
There also remain hurdles for the markets to overcome near-term that include, but are not limited to, Brexit, U.S./China trade negotiations completing and a Euro Zone slowdown that demands increasing trade with China to recapture growth momentum. And of course, while central banks have become more accommodative to economic growth in 2019, the focus on central banks after a 10-year long expansion will not diminish within the scope of rationalizing central bank policies. Flattening yield curves and negative bond yields around the world will continue to highlight central bank policies and messaging, as they attempt to normalize rates and should firming of the global economy become the H219 theme.
A return to trend-growth in 2019 should be accommodative to earnings growth of 5-8% year-over-year, but multiple expansion may be fleeting and less probable over the next 2 quarters and until late 2019.
Comments
Log in or sign up to join the conversation.