
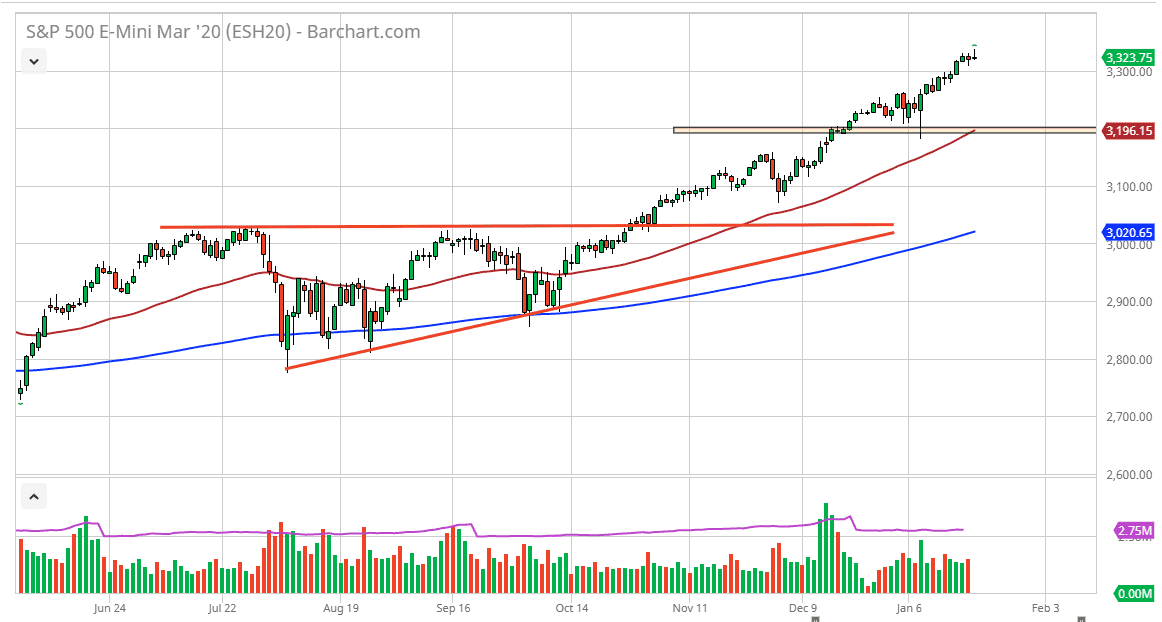
S&P 500 Forecast: Looking For Buyers
The S&P 500 had rallied a bit during the trading session on Wednesday, to reach to a fresh, new high but then gave back quite a bit of the gains. By doing so, the market ended up forming a shooting star-like candlestick, but it is preceded by the hammer from Tuesday. At this point, I believe that the market is likely to go back and forth to try to find buyers. I believe that the 3300 level would also be a supportive level. If we were to break down below that level, it’s very likely that the 3250 level will offer support, just as the 3200 level well. In fact, I believe that the 3200 level is an excellent opportunity if we get down to that level as it is not only previous support, but it is also where the 50 day EMA currently resides.
If we were to break down below the 50 day EMA, then it’s likely that the market will probably find even more selling pressure, perhaps reaching down towards the 3100 level. All things being equal though, I don’t think that happens without some type of rather a negative headline. At this point, if we were to break out to the upside, it’s likely that it would be a rather impulsive move and you would have to be very careful been long of this market.
At this point, you should be looking for value and therefore value means lower pricing. At this point, I like the idea of a pullback offering an opportunity to pick up the stock market “on the cheap.” Ultimately, this is a market that I think can’t be shorted anytime soon, unless of course, we have some type of major turnaround when it comes to the fundamentals in the United States or some type of extraneous shock to the system. It is in the middle of earnings season, so it’s possible we may get a bit of a pullback due to a couple bad headlines here and there, but if you are patient enough you should be able to use that to your advantage and get a better price in what has been a longer-term uptrend. Furthermore, the Federal Reserve continues to add to its balance sheet, so that is a nice correlation between this chart and what they are doing. Ultimately, this is a market that moves right along with what the Federal Reserve is doing.
(Click on image to enlarge)
Disclaimer: DailyForex will not be held liable for any loss or damage resulting from reliance on the information contained within this website including market news, analysis, trading signals ...
more

