S&P 500 ETF Looking To End Impulsive Rally
Image Source: Unsplash
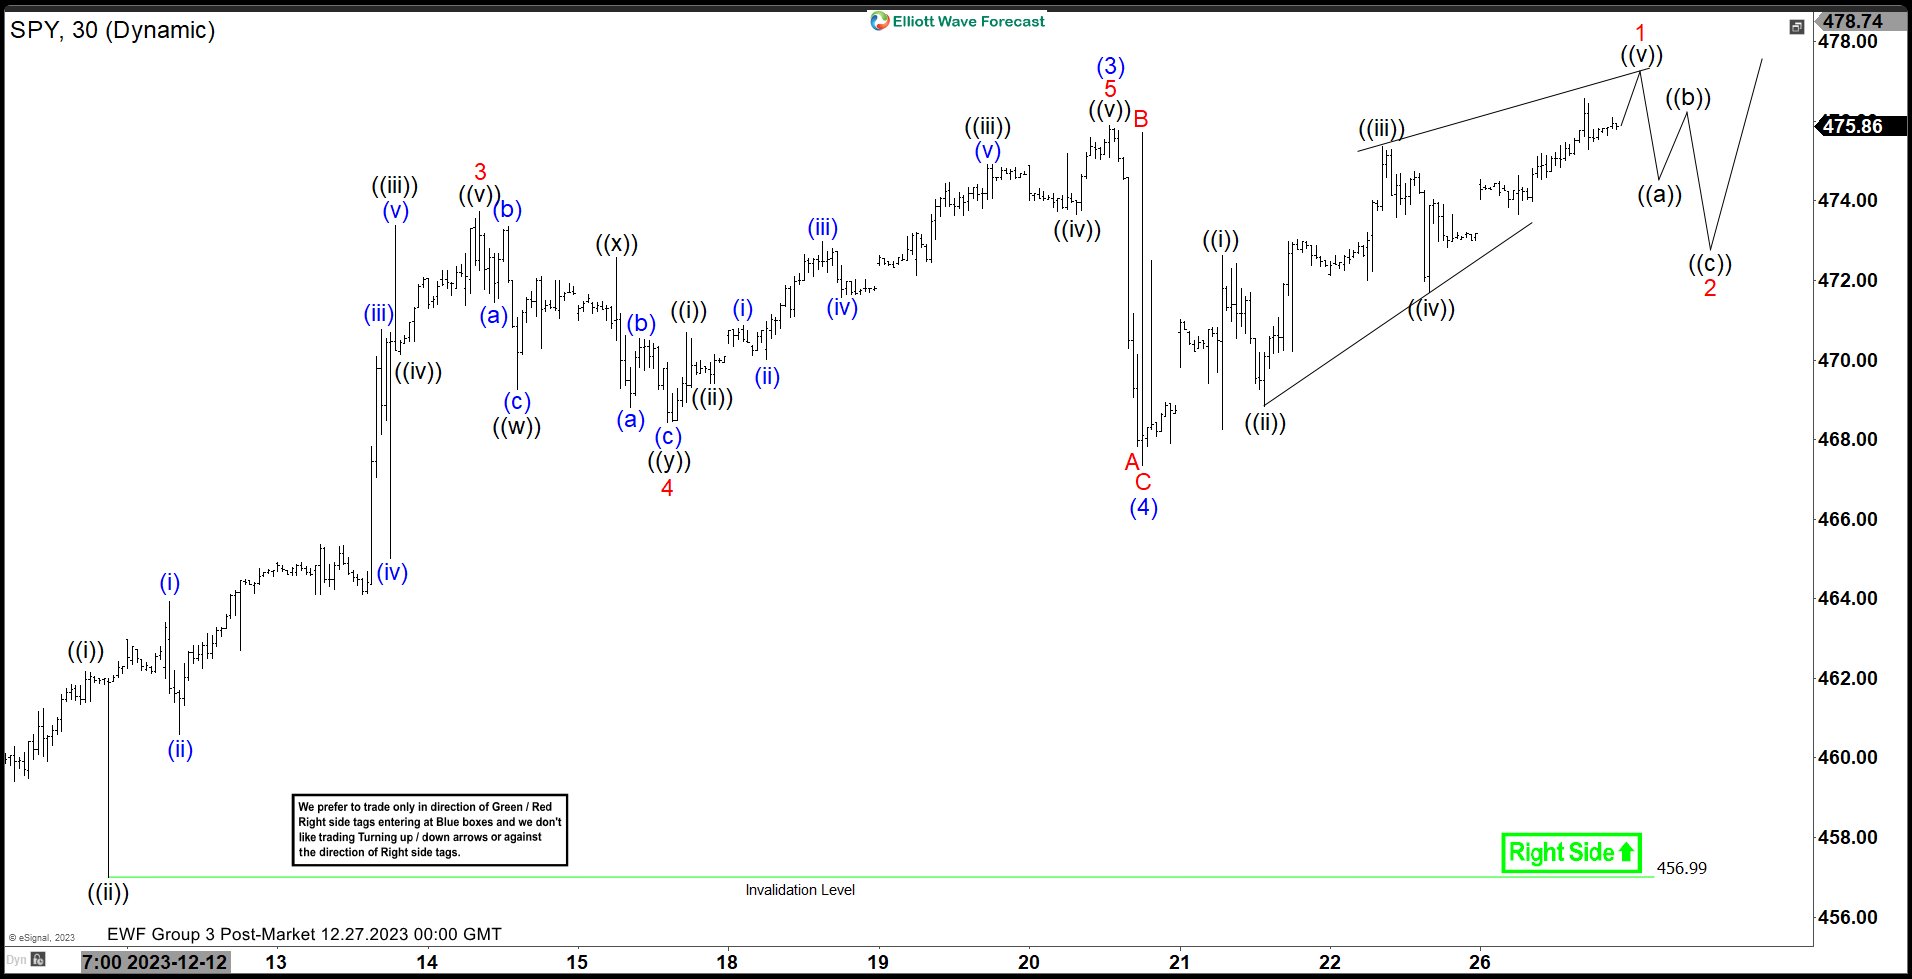
Short-term Elliott Wave View in S&P 500 ETF (SPY) shows the rally from the October 28 low is in progress as a 5-wave impulse Elliott Wave structure. Up from the October 28 low, wave (1) ended at 459.9, and a pullback in wave (2) ended at 454.34. The ETF then rallied higher again in wave (3) towards 475.89 and dips in wave (4) ended at 467.36. Wave (5) is in progress as another 5 waves to a lesser degree. The 30-minute chart below shows the move higher to the end wave (3).
Up from wave 94), wave ((i)) ended at 472.64, and a pullback in wave ((ii)) ended at 468.84. The ETF extended higher again in wave ((iii)) towards 475.38 and dips in wave ((iv)) ended at 471.70. Expect the ETF to end wave ((v)) soon and this should complete wave 1 of (5) to a higher degree. It should then pull back in wave 2 to correct the cycle from the 12.21.2023 low before the rally resumes. Near term, while above 467.36, and more importantly above 456.99, expect dips to find support in 3, 7, or 11 swings and the ETF to extend higher.
S&P 500 ETF (SPY) 30 Minutes Elliott Wave Chart
SPY Elliott Wave Video
Video Length: 00:05:12
More By This Author:
West Pharmaceutical Services Bullish Daily CycleXLI Elliott Wave: Buying The Dips At The Blue Box Area
Costco Wholesale Continues Upside In Bullish Sequence
Disclaimer: Futures, options, and over the counter foreign exchange products may involve substantial risk and may not be suitable for all investors. Leverage can work against you as well as for ...
more


