
S&P 500 And Nasdaq 100 Forecast - January 20, 2016
S&P 500
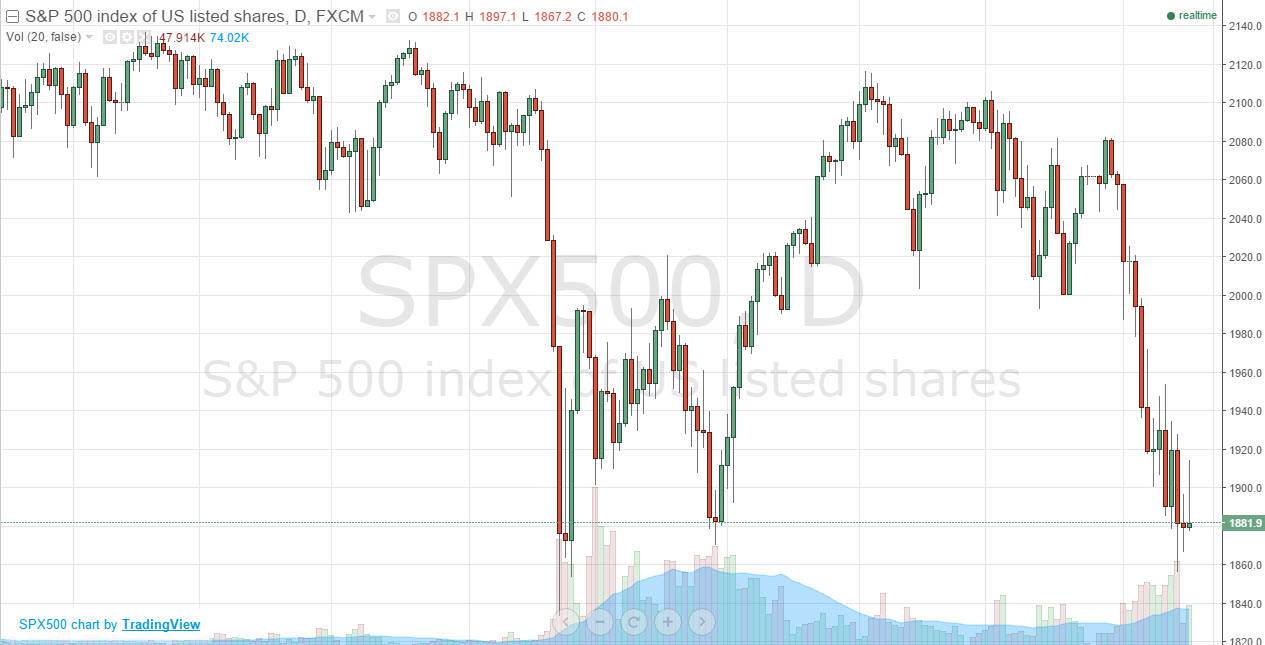
The S&P 500 initially tried to rally during the day on Tuesday but sold off and ended up forming a significant shooting star. The shooting star the bottom of a downtrend of course is a very negative sign, and as a result I feel that this market is eventually going to trying to break down below the support that has held the market up recently, and perhaps even grind down to the 1800 level. However, we have to get through the 1860 level first, as it has been so supportive.
I don’t really have any interest whatsoever in buying this market until we get above the 1950 handle, which would be very bullish in my opinion as we have broken above pre-significant resistance at that point in time. A move above there should send this market looking for the 2000 level, which of course is a large, round, psychologically significant number.
(Click on image to enlarge)
Nasdaq 100
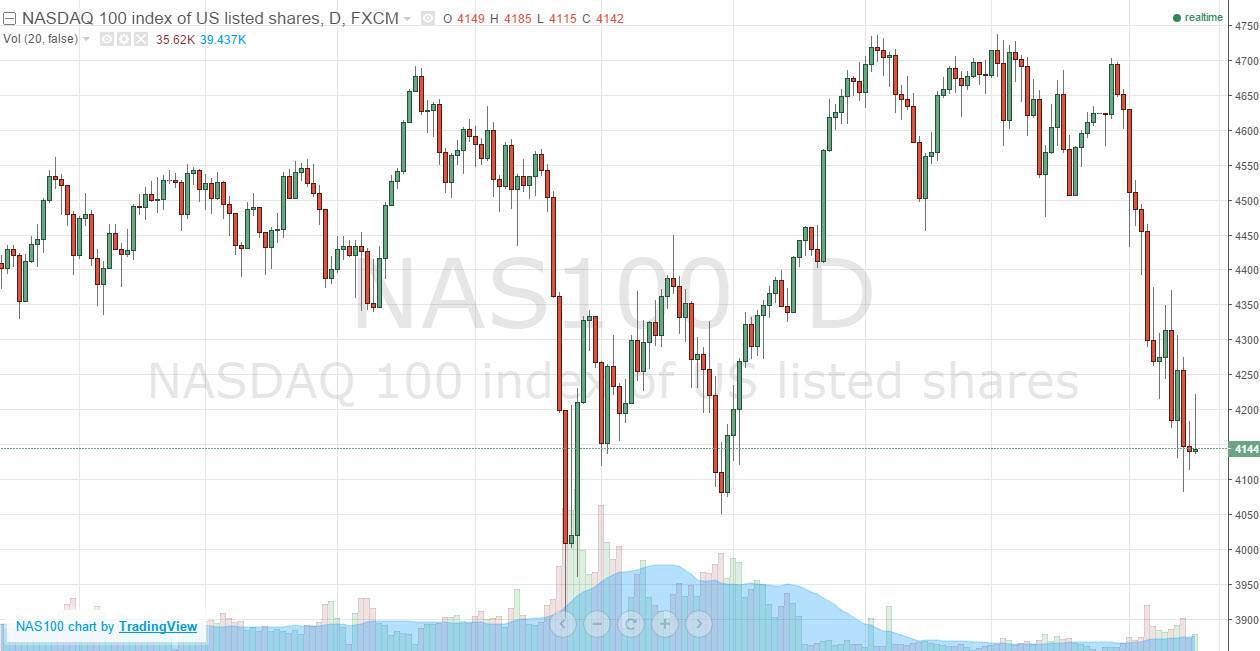
The Nasdaq 100 tried to rally during the course of the day on Tuesday, but found more than enough resistance just above the 4200 level to turn things around and form a shooting star. The shooting star of course is a very negative sign, and it now looks as if we are going to try to break down below the 4100 level. If we can do so, the market could very well find itself testing the 4000 level below.
At this point in time, I don’t really have a scenario in which I want to start buying, unless of course we break above the 4350 level which looks very unlikely at this point. On top of that, I would have to see bullish behavior in stock markets around the world, something that just simply doesn’t look like it’s going to happen anytime soon. With this, I believe that the Nasdaq 100 is going to continue to offer selling opportunities on short-term rallies and of course the aforementioned break down.
(Click on image to enlarge)
Disclosure: None.


I respect the charts but on $SPY I saw the T-30 pattern clear as day. $AAPL $FB & $NFLX especially followed.